Ad Hoc Payments-A Leading Indicator of Farm Policy Change
Since 1973, US farm program payments follow a process of moving from one regime or plateau to another, with the move occurring in a one to two year period. Two times since 1973 farm payments have increased to a higher plateau. The increase was preceded by an increase in ad hoc payments made outside of existing farm safety net programs. The higher ad hoc payments were then incorporated into the farm bill safety net. Therefore, the sharp rise in ad hoc payments in 2019 and 2020 could be a leading indicator of sustained higher farm payments into the future, perhaps double their 2007-2017 average.
Background
Ad hoc farm payments are payments by programs that are not part of the existing farm safety net and usually cover current and past, not future, production. They started in the 1970s when Congress enacted emergency disaster aid for farms impacted by low yields (Chite; Glauber). This assistance provided the foundation for the Federal Crop Insurance Act of 1980, which began the process of transforming a limited insurance program for crops into a multi-billion dollar insurance program for crops and livestock.
Farm Payments
Source for the payment data used in this analysis is the farm income and wealth data file maintained by USDA ERS (US Department of Agriculture Economic Research Service) (see Data Note 1). Focus of this study is government payments whose primary objective is to support farm income. Thus, payments to farms from conservation and energy programs are excluded. The analysis starts with 1974. The 1973 Farm Bill marked a key step in converting farm support into payments to farms, a process that began in the 1960s. The 1973 Farm Bill introduced the concepts of target prices and deficiency payments (Coppess; Orden, Paarlberg, and Roe.). Deficiency payments compensated farms for part of the difference between the target price and a lower market price. Deficiency payments also likely created the need for ad hoc assistance. The lower market prices allowed by target prices created the potential for farms to simultaneously have both low prices and low yields, thus increasing the severity of financial stress resulting from low yields.
Farm payments since 1973 can be seen as a series of regimes or plateaus (see Figure 1).
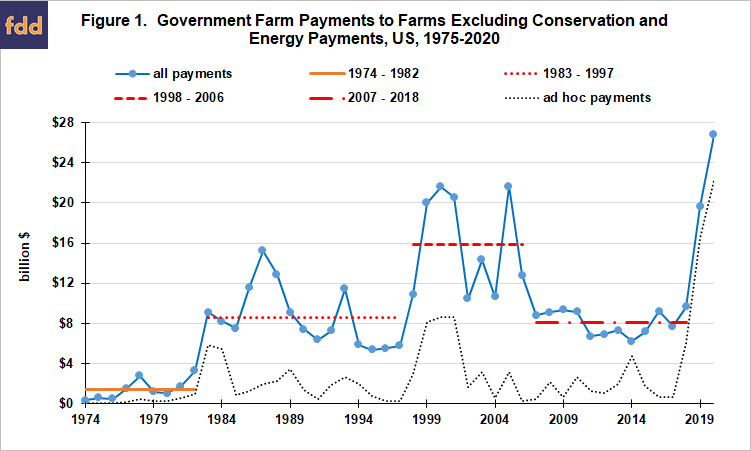
1974-1982: Farm income support payments to US farms averaged $1.5 billion per year during a period mostly characterized as one of crop prosperity.
1983-1997: Average payments increased to $8.9 billion per year. This regime began with the Payment-in-Kind (PIK) ad hoc program of 1983. PIK was created by President Reagan’s administration to reduce stocks, particularly of corn. The 1985 Farm Bill captured the PIK payments as higher deficiency payments resulting from a sharp reduction in loan rates and thus market prices.
1998-2006: Average payments again increased, to $15.9 billion per year. This plateau began with high ad hoc payments from the Market Loss Program for 1998-2001 non-oilseed program crops and the Oilseed program for 1999 and 2000 crops. The ad hoc payments were authorized by Congress in response to declining crop prices, partly due to a slowdown in demand growth caused by the world financial crisis of 1998. The 2002 Farm Bill captured these ad hoc payments by reinstituting deficiency payments which the “Freedom-to-Farm” Bill of 1986 had replaced with fixed per unit payments.
2007-2018: Payments averaged $8.1 billion per year. Payments fell about 50% during the prosperity of 2007-2013 and did not increase when crop prices fell after 2012. The 2014 Farm Bill eliminated fixed payments, converting them into an equivalent amount of countercyclical ARC (Agriculture Risk Coverage) and PLC (Price Loss Coverage) payments.
In 2019-2020, farm payments surged to post 1973 highs, averaging $23.2 billion. Eighty-four percent are ad hoc payments, primarily from MFP (Market Facilitation Program) and CFAP (Coronavirus Food Assistance Program). President Trump’s Administration initiated MFP in response to losses from disruptions in US exports related to tariffs the US imposed on imports from certain countries, notably China. Congress authorized CFAP in response to losses from the COVID-19 pandemic. Besides 1983-1984 and 1998-2001, 2019-2020 is the only consecutive, multi-year period during which ad hoc payments exceeded their $2.9 billion per year average from 1974 through 2020 (see Figure 1). Note that 2020 payments are an estimate (see Data Note 2).
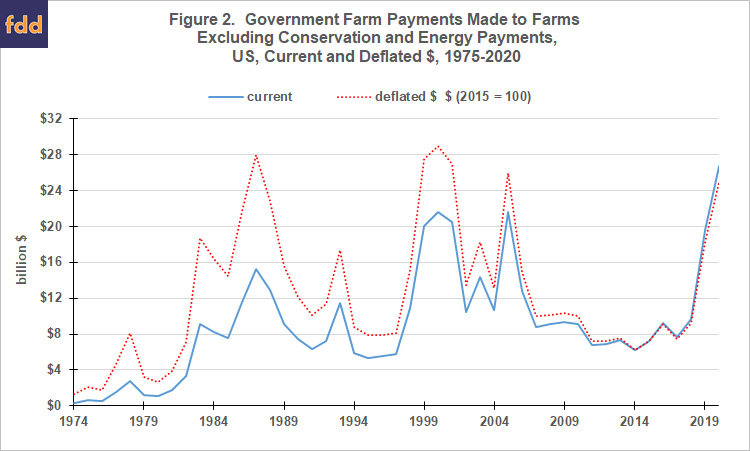
When examining government spending and payments over time, it is common to use both current and deflated dollars. This comparison is presented in Figure 2 using the GDP implicit price deflator. The regimes remain identifiable in deflated dollars, probably because the periods are relatively short and inflation was low during the last half of the analysis period. One potential change in the storyline is that farm payments in 2020 may not be a post-1973 high in deflated dollars. Deflated farm payments may end up being higher in 1987, 1999-2001, and 2005.
Concluding Observations
Since 1974, farm payments have followed a path of moving from one payment regime or plateau to another within a one to two year period. Moves to a higher regime were initiated by stress factors that resulted in a sharp increase in ad hoc payments. The higher ad hoc payments were subsequently then incorporated into farm bill safety net programs. The process repeats itself when a new stress emerges.
A rationale for ad hoc payments serving as a leading indicator is that increased ad hoc payments are an indication that policy participants believe the existing safety net delivers an inadequate level of assistance even though they likely believed that the level of assistance was adequate when the existing safety net was enacted.
The sharp increase in ad hoc payments in 2019 and 2020 raises the question of whether a move to a higher plateau of farm bill safety net payments is currently underway.
Continuation of high ad hoc payments could be seen as a statement by policy that market-based farm prosperity remain an attainable aspiration in the near future. On the other hand, incorporation of current high ad hoc payments into the farm bill safety net could be seen as an acknowledgement by policy that market-based farm prosperity is not attainable in the near, perhaps intermediate, future.
If a move to higher payments from the farm bill safety net is occurring, it could end up being a return to the 1996-2006 payment plateau that predated the 2007-2013 period of farm prosperity.
If the preceding point is a correct forecast, about $8 billion in annual farm payments are available for distribution. Potential options include larger payments to current program commodities, permanent support for non-program commodities that received 2018-2019 ad hoc payments, more spending on insurance, and increased spending on conservation programs with a dual objective of reducing supply.
Data Notes
- USDA ERS did not report payments in an ad hoc and emergency payment category until 1998. Prior to 1998, such payments were reported in the miscellaneous category.
- Farm payments for 2020 are USDA ERS estimates as of February 2020 plus an estimated $16 billion in CFAP payments (USDA, Farmers.gov). The latter were announced after the February 2020 estimates were released.
References and Data Sources
Chite, R.M. 1988. Federal Crop Insurance: Background and Current Issues. Congressional Research Service Report No. 88– 739 ENR. December.
Coppess, J. 2018. The Fault Lines of Farm Policy: A Legislative and Political History of the Farm Bill. University of Nebraska Press: Lincoln and London.
Glauber, J.W. 2012. The Growth of the Federal Crop Insurance Program, 1990–2011. American Journal of Agricultural Economics 95(2): 482-488.
The National Agricultural Law Center. 2020. Copies of all US farm bills. July. Available online: http://nationalaglawcenter.org/farmb+ills/
Orden, D., R. Paarlberg, and T. Roe. 1999. Policy Reform in American Agriculture: Analysis and Prognosis. Chicago: University of Chicago Press.
US Department of Agriculture, Economic Research Service. 2020. Farm Income and Wealth Statistics. February. Available online: https://www.ers.usda.gov/data-products/farm-income-and-wealth-statistics/
US Department of Agriculture, Farmers.gov. 2020. Coronavirus Food Assistance Program Cost-Benefit Analysis. May 14. Available online: https://www.farmers.gov/sites/default/files/documents/CFAP%20CBA%205%2015%202020.pdf
Source: Carl Zulauf, Gary Schnitkey, Jonathan Coppess, Nick Paulson, Krista Swanson, Farmdocdaily