Agricultural Professionals Expect Lower Land Values and Stable Crop Prices
Over 270 agricultural professionals attended the 2019 ISU Soil Management Land Valuation (SMLV) Conference this past May. This is the longest running conference at Iowa State University for both research and extension, and 2019 marked the 92nd annual meeting in this series. Over 150 participants provided their estimates of future land values as well as future cash corn and soybean prices in their primary county in Iowa via an online Qualtrics survey. Overall, the agricultural professionals forecasted a continued modest decline in land values in Iowa as well as stable cash crop prices. This article provides an overview discussion of these forecasts, and shares perspectives on future land and crop markets as well as risk management strategies.
Land value forecasts
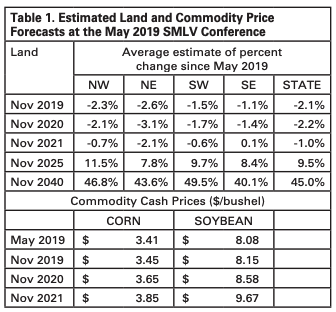
Agricultural lenders accounted for one third of all respondents, followed by farm managers, real estate brokers/realtors, appraisers, and auctioneers. Each respondent provided the name of the primary county that they provide service in, and then was asked to provide estimates for land values and cash commodity prices for the service area. Each respondent provided dollar per acre estimates of land values for May 2019, November 2019, November 2020, November 2021, November 2025, and November 2040; and we calculated the average estimate of the percentage change in land values relative to May 2019. We did this transformation because the percentage change estimates are more transferrable than land value estimates with other data sources. We grouped all individual counties into one of the four quadrants across Iowa and calculated the regional-average short-, medium-, and long-term land value estimates, as well as the statewide average land and crop price estimates. These results are presented in Table 1.
Table 1 shows that overall respondents expect a 2% decline in land values in their local area over the next six months from May to November 2019. It also shows that these agricultural professionals expect the land market in Iowa to remain flat from November 2019 to November 2020. In particular, they expect land values to decrease by 2.1% from May to November 2019, while the expected land value decline is 2.2% from May 2019 to November 2020. In contrast, the respondents expect only 1.0% decline from now to November 2021, which is equivalent to an expected 1% increase in land values from November 2020 to November 2021. To summarize, the agricultural professionals expect an immediate, modest decline in land values, followed by stable to slightly rising land markets. It is important to note that the annual inflation rate over the next few years will likely be close to 2%, so even the 1% bump in nominal land values from 2020 to 2021 would be modest declines in inflation-adjusted terms.
Put simply, land value equals income divided by interest rate. U.S. farm income has fallen by half off the 2013 peak, and the records from the Iowa Farm Business Association show that a quarter of producers are experiencing liquidity problems and low working capital. The heightened uncertainty about the U.S.-China trade relations is another reason for the dampened commodity and land market outlook. U.S. Federal Reserve is likely to hold off its moves to further raise interest rates, which helps ease the downward pressure on the land market. However, the previous interest rate hikes will take several years to be absorbed in the land market. The expected land market declines are consistent with other data sources: for example, the percent of respondents expecting a lower land value a year from now jumped from 20% to 28% according to the Purdue University Ag Economy Barometer, https:// ag.purdue.edu/commercialag/ageconomybarometer/.
It is worth noting that income is often localized while interest rates are often universal, leading to local variations across land market changes. Table 1 revealed that northern Iowa expected a slightly larger immediate drop in land values compared to southern Iowa, and northwest Iowa is the only region that expects a minor increase in land values from November 2019 to November 2020, while all other areas expected more declines. This likely is due to higher livestock mix of northwest Iowa and stronger demand for higher quality land. Table 1 also presents the respondents’ medium- and long-term land value forecasts for November 2025 and 2040. Granted, we should interpret these results with a grain of salt given their longer horizon. In general, the respondents expect the land market to bounce back in five years and continue to rise in the long run. It is informative to compare their current forecasts with their forecasts last year: in May 2018, the respondents had a rosier outlook about the long run land values. They expected a 16% increase in land values from May 2018 to November 2025, and 57% increase in land values from May 2018 to November 2040. The reduction in the optimism among the respondents likely reflects growing concerns about U.S.-China trade disruptions and financial stress.
Commodity price forecasts
Table 1 also presents the respondents’ average statewide forecasts of cash corn and soybean prices for May 2019, November 2019, November 2020, and November 2021. On average, the respondents expect the November 2019 cash corn and soybean prices are $3.45/bushel and $8.15/bushel, respectively. And they expect the cash prices to increase slightly to $3.85/bushel and $9.67/bushel for corn and soybean two years from now. It is worth noting that the respondents expect a much higher jump for cash soybean prices from November 2020 to November 2021. This may implicitly reflect how respondents anticipate improvements in soybean trade.
It should be noted that forecasting cash corn and soybean prices at four points in time from May 2019 thru November 2021 to prove more challenging than that of land values, even with the existence of commodity futures markets. That is because of the uncertainty of U.S. and global supply and demand for those crops over that period forecast. Also, the cash prices forecasted reflect a basis consideration (cash minus the nearby futures contract price) which during the month of November in Iowa could mean cash prices 20 to 50 cents per bushel for corn and 50 cents to $1.00 per bushel for soybeans below the futures prices at harvest. These futures contracts tend to be December for corn and November for soybeans, respectively.
Now, consider the unknown of adverse weather conditions, during late April and first half of May 2019 when most respondents provided their crop cash price forecasts. During the last half of the month of May, wet conditions continued with planting delays across much of the Corn Belt. As a result, the December 2019 corn futures prices rallied nearly 90 cents per bushel (24% higher) and November 2019 soybean futures by $1.00 per bushel (12% higher), respectively.
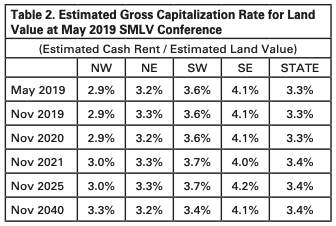
In summary, when forecasting corn and soybean cash prices, one must consider several factors that affect global supply and demand that impact these commodities. Note, respondents were forecasting only cash commodity prices for four different periods, which reflected an assumed basis. Missing in these forecasts was the underlying seasonality of new crop futures prices, which had yet to occur in 2019. Expect futures price rises occur most years during the spring months and can impact commodity cash price forecasts collected during the late April and early May timeframe. Gross capitalization rate forecasts Finally, the respondents provided cash rent estimates for the corresponding time-horizon, for which we calculated the gross capitalization rates for the land market as their gross cash rent estimates divided by land value estimates (Table 2). Interestingly, the respondents expect the gross capitalization rates to be stable around 3.3% from now to 2040. In other words, respondents expect cash rent to rise or decrease at the same pace with the land values.
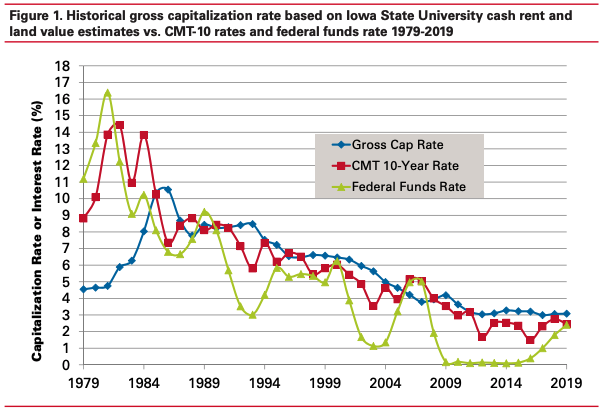
Using average cash rent and average farmland values from the ISU Cash Rent Survey and ISU Farmland Value Survey from 1979 to 2018, respectively, we calculated the gross capitalization rates in the same fashion by dividing the statewide average cash rent by state average land values. We then contrast the historical gross cap rates with two benchmark interest rates: the 10-Year Treasury Constant Maturity Rate (CMT-10 rates) and the Federal Funds Rate which is directly set by Federal Reserve Bank. Figure 1 shows that over the past three decades, the gross capitalization rates for the farmland market in general followed closely with the CMT-10 rates. Interest rates not only affect the financing costs for land purchase, but more importantly it reflects the returns on alternative risk-free assets in addition to farmland. Currently, interest rates are still on an upward trajectory, which could imply a higher capitalization rate. That could imply a lower land value, which is consistent with the respondents’ land value forecasts shown in Table 1.
Source: Wendong Zhang and Steven Johnson, Ag Decision Maker, Iowa State University Extension and Outreach