Another Look at Late Planting of the 2019 Soybean Crop
The lateness of planting the 2019 U.S. soybean crop has rightfully been getting a lot of attention. We have highlighted this issue and its implications for acreage, yield, and prices in two previous farmdoc daily articles (May 9, 2019; June 6, 2019). The measure of late planting used in these articles: i) reflects only soybean acres planted fairly late in the planting window; ii) is computed for the entire U.S., and iii) starts in 1980. The purpose of this article is to introduce an alternative measure of the timeliness of planting the 2019 soybean crop that can be computed over a longer time period and at the individual state level for Illinois, Indiana, and Iowa. This will provide additional perspective on the magnitude of late soybean planting in 2019. The analysis parallels that of corn in the farmdoc daily article of June 12, 2019.
Analysis
The measure of late planting for soybeans used in previous farmdoc daily articles (e.g., June 6, 2019) is based on the percentage of soybeans planted late in the U.S. over 1980-2019 based on a June 5 cutoff from 1980 through 1985, and a May 30 cutoff date from 1986-1999, and a May 25 cutoff from 2000-2019. The change in cutoff dates in the mid-1980s and late May in 2000 reflects recommendations for earlier planting that appeared around that time. This specification emphasizes soybean acres planted well past the optimum planting window as historically defined by agronomic planting date field trials. Figure 1 presents this measure and it shows that, on average, late planting was 39.2 percent. The average level of late planting for soybeans, 39.2 percent, is much higher than for corn, 17.7 percent, which was reported in the farmdoc daily article of June 12, 2019. At least half of this difference can be attributed to double-crop planting of soybeans. Late-planted soybean acreage in 2019 came in at the highest total since 1980 with 72 percent remaining to be planted as of March 30. While 2019 was the highest in the sample period, note that late planting was almost as high in two previous years (1990 and 1995).

An alternative measure of planting timeliness was introduced by Irwin, Good, and Tannura (2008). This measure is based on the number of days before or after May 1st that planting progress reaches 50 percent. Since USDA planting progress is only available on a weekly basis, the calendar date of 50 percent completion is estimated by daily interpolation using the two weeks that bracket 50 percent completion. This is an “absolute” measure of timeliness since the midpoint of planting progress is always compared to a fixed calendar date (May 1st). In contrast to the measure presented in Figure 1, the 50 percent measure will reflect trends towards earlier planting progress over time. Irwin, Good, and Tannura argued that this is a more robust measure of trends in planting progress than other measures. For example, Kucharik (2008) computes the calendar date when 10 percent planting progress is reached. In some years, the first reported data on planting progress is larger than 10 percent, which implies that the 10 percent date is projected without knowledge of actual planting progress in the previous week. Since non-zero planting progress is nearly always reported for the week before and after 50 percent progress is reached, this same problem is highly unlikely to affect the measure proposed by Irwin, Good, and Tannura.
We compute the number of days before or after May 1st that 50 percent soybean planting progress is reached in Illinois, Indiana, and Iowa over 1960 through 2019. These three states contained 30 percent of the soybean acreage planted in the U.S. during 2018 and should be representative of planting rates over much of the Corn Belt. Figures 2-4 present this measure for each state, respectively, with positive observations on the vertical axis indicating the number of days after May 1st that 50 percent planting progress is reached and negative observations indicating the number of days before May 1st. Estimated linear trend lines over 1960-2019 are also included in each figure.

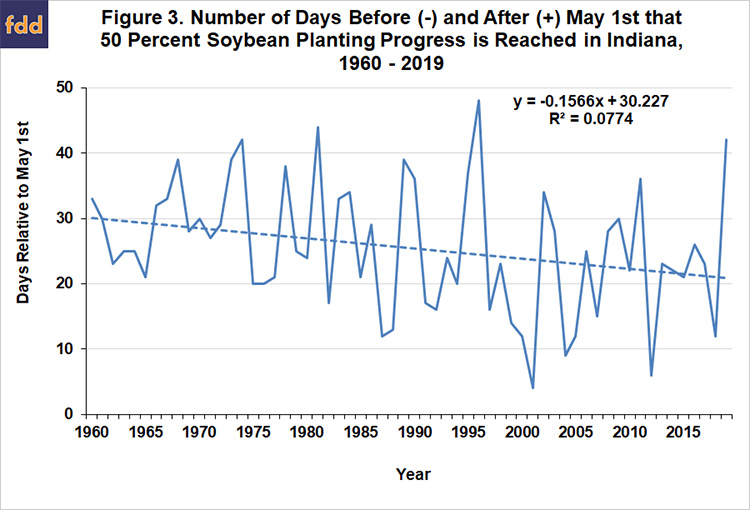

While Figures 2-4 indicate there has been substantial annual variation in planting progress in each state from year-to-year, a clear trend towards earlier planting is evident. Since 1960, the trend lines indicates that the 50 percent completion date moved from about May 30th to May 20th for Illinois and Indiana, and from about May 25th to May 15th for Iowa. In general, the 50 percent progress date in these three states is now about 10 days earlier than in 1960. While this is clearly a move towards significantly earlier planting for soybeans, it is not as large as the shift of two to three weeks earlier observed for corn since 1960 (farmdoc daily, June 12, 2019). Another observation is noteworthy in Figures 2-4. Specifically, the trend towards earlier planting in soybeans has been surprisingly steady for the last six decades. This contrasts with corn, where the biggest moves toward earlier planting dates occurred in the 1960s and 1970s and only modest moves toward earlier planting were observed since the mid-1980s.
With this background, we can provide additional perspective on the timeliness of soybean planting in 2019. Figure 2 shows that Illinois soybean planting in 2019 did not reach 50 percent completion until June 10th. This was the fourth latest date for reaching 50 percent in the last 60 years. The latest year was 1996, when 50 percent was reached on June 10th. Alternatively, the 50 percent date in 2019 for Illinois was 21 days above trend, the second highest since 1960. The highest year relative to trend was 1974, when the 50 percent date for Illinois was 22 days above trend. The story in Figure 3 for Indiana and Figure 4 for Iowa is largely the same as for Illinois. Soybean planting progress in 2019 did not reach 50 percent completion in Indiana until June 12th, which was 21 days above trend, the second highest of the last 60 years. Soybean planting progress in 2019 did not reach 50 percent completion in Iowa until June 5th, which was 17 days above trend and was the highest of the last 60 years.
Implications
It is common knowledge that the 2019 U.S. soybean crop has been planted late due an exceptionally wet spring. We provide additional perspective on the magnitude of late planting by computing the number of days before or after May 1st that 50 percent soybean planting progress is reached in Illinois, Indiana, and Iowa over 1960 through 2019. Since 1960, the trend in the 50 percent completion date moved from about May 30th to May 20th for Illinois and Indiana, and from about May 25th to May 15th for Iowa. In general, the 50 percent progress date in these three states is now about 10 days earlier than in 1960. The analysis also shows that soybean planting in 2019 did not reach 50 percent completion until June 10th in Illinois, June 12th in Indiana, and June 5th in Iowa. Relative to trend, these were the first or second latest dates for reaching 50 percent completion in the last 60 years. So, by any measure, soybean planting in 2019 was extraordinarily late.
References
Irwin, S., D. Good, and M. Tannura, “Forming Expectations About 2008 U.S. Corn and Soybean Yields—Application of Crop Weather Models that Incorporate Planting Progress.” Marketing and Outlook Brief 2008-03, Department of Agricultural and Consumer Economics, University of Illinois at Urbana-Champaign, July 2008.
Irwin, S. and T. Hubbs. “Another Look at Late Planting of the 2019 Corn Crop.” farmdoc daily (9):108, Department of Agricultural and Consumer Economics, University of Illinois at Urbana-Champaign, June 12, 2019.
Irwin, S. and T. Hubbs. “Late Planting and Projections of the 2019 U.S. Soybean Yield.” farmdoc daily (9):104, Department of Agricultural and Consumer Economics, University of Illinois at Urbana-Champaign, June 6, 2019.
Irwin, S. and T. Hubbs. “Late Planting and Projections of 2019 U.S. Corn and Soybean Acreage.” farmdoc daily (9):85, Department of Agricultural and Consumer Economics, University of Illinois at Urbana-Champaign, May 9, 2019.
Kucharik, G.J. “Contribution of Planting Date Trends to Increased Maize Yields in the Central United States.” Agronomy Journal 100(2008):328-336.
Source: Scott Irwin and Todd Hubbs, Farmdocdaily