Anticipating USDA’s 2019 Net Farm Income Forecast
The USDA’s Economic Research Service (ERS) first forecast of 2019 net farm income was initially scheduled for a February 6 release, but the partial government shutdown caused a delay in the release of a number of USDA statistics and reports. As a result, ERS will release its first forecast of 2019 net farm income on March 6. This article develops a prediction of ERS’ 2019 net farm income forecast based on forecasts from recent years.
ERS’s Net Farm Income Forecast
ERS defines net farm income as “the residual income leftover after all the factors of production are paid. It represents the returns for operator labor, management, and equity, as well as any other unpaid resources used for farm production instead of elsewhere.” ERS typically releases four forecasts of net farm income a year: in February, in August, in November, and in February following the reference year, when the first forecast of the new year is released. Thus, ERS scheduled March 6 release will include the final forecast for 2018 and the first forecast of 2019.
Predicting ERS’s Initial Forecast
ERS’s initial forecasts tend to be conservative. That is, they under-predict realized net farm income on average (farmdoc daily February 21, 2018). In addition, the series of forecast revisions tend to follow a predictable pattern, or in other words, the forecast revisions are correlated with one another. Figure 1, below, plots the relationship between the initial forecast of each year and the November forecast of the prior year (the most recent forecast of the previous year). As the figure suggests, the initial forecast is positively correlated with the November forecast revision from the previous year (correlation coefficient of 0.82).

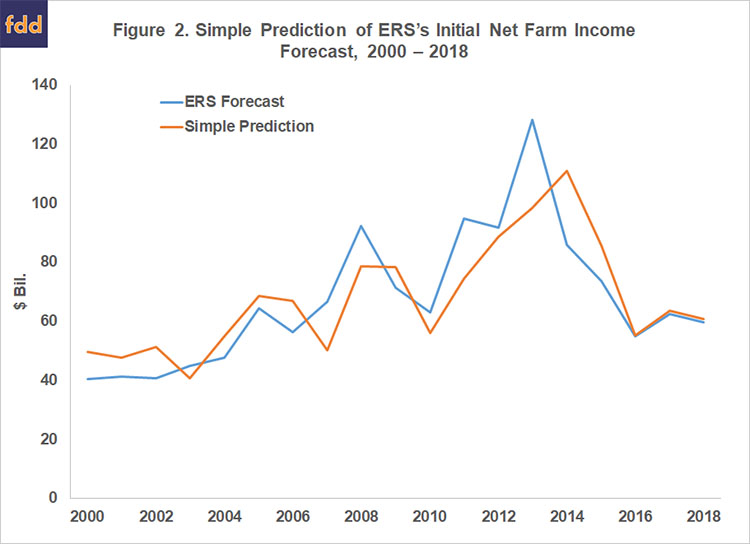
The line of best fit between the initial forecast and the previous November forecast provides a simple linear prediction of initial forecast values. The regression equation shown in Figure 1 explains about 67% of the variation in initial forecast values between 2000 and 2018. Figure 2 plots the initial net farm income forecast (blue line) released by ERS along with the simple prediction obtained from the line of best fit (orange line).
As Figure 2 suggests, this simple prediction provides a fairly accurate projection across most of the observation period. The simple prediction’s largest errors are found during the transition from high to low net farm income in 2013 and 2014.
ERS’s November revised forecast of 2018 net farm income was $66.3 billion. The simple prediction provided by the line of best fit, therefore, suggests that initial forecast of 2019 is expected to be around $63 billion. This value is below ERS’s most recent forecast of 2018 net farm income, but it exceeds the initial forecast for 2018 at $59.5 billion.
References
Ingwersen, Julie. “U.S. Delays Key Agriculture Reports Due to Government Shutdown.” Reuters, January 4, 2019. https://www.reuters.com/article/us-usa-shutdown-usda/u-s-delays-key-agriculture-reports-due-to-government-shutdown-idUSKCN1OY1K9
Kuethe, T. “Will Farm Income Really Drop to a 12-Year Low in 2018?” farmdoc daily (8):30, Department of Agricultural and Consumer Economics, University of Illinois at Urbana-Champaign, February 21, 2018.
Source: Todd Kuethe, Farmdocdaily