ARC-IC: Payment Examples and Revised 2019 ARC-IC Payment Calculator
Agricultural Risk Coverage at the Individual Level (ARC-IC) will be an attractive alternative for farmers who had FSA farms that were completely prevented plant or had low yields in 2019. In this article, we show that a $24 per base acre payment could result for a LaSalle County farm that has a 195 bushel per acre corn yield and a 50 bushel per acre soybean yield. Payments are demonstrated with the revised 2019 ARC-IC Payment Calculator in the 2018 Farm Bill What If Tool. The deadline to make commodity decisions for the 2019 and 2020 years is March 15, 2020.
ARC-IC and the Revised ARC-IC Tool
ARC-IC will be an attractive alternative for receiving commodity title payments under the 2018 Farm Bill for those farms who had low 2019 yields or entire Farm Service Agency (FSA) farms that are prevent plant (see farmdoc daily, October 29, 2019 for ARC-IC information and the 2018 Farm Bill Tool Box, https://farmdoc.illinois.edu/2018-farm-bill for more information on commodity title choices). Farmers can enroll one or more FSA farms in ARC-IC. ARC-IC will then provide a whole-farm guarantee for all FSA farms enrolled in ARC-IC within a state. In 2019, farmers who have a farm that is entirely prevented plant or had low yields likely will find that ARC-IC will make larger payments than ARC at the county level (ARC-CO) or Price Loss Coverage (PLC).
Calculations of 2019 ARC-IC payments can be made using the 2019 ARC-IC Payment Calculator, a tool that is contained in the 2018 Farm Bill What If Tool, a Microsoft Excel spreadsheet available for download from the 2018 Farm Bill Tool Box (https://farmdoc.illinois.edu/2018-farm-bill) page in farmdoc. This tool calculates a 2019 ARC-IC payment for specific yields and Market Year Average (MYA) prices in 2019. Payments are calculated for one FSA farm.
The ARC-IC tool was revised from its initial release. Specific changes made were:
- New substitute county yields were incorporated into the spreadsheet. These were released by FSA last week and are trend adjusted.
- Choices related to irrigated and non-irrigated practices were eliminated as ARC-IC uses all crop in a county to determine benchmarks and yields.
- Errors in the third and fourth crops were fixed.
- Errors related to minor oilseeds were fixed.
These changes are incorporated on the tool releases dated on and after January 31, 2020.
The ARC-IC tool is demonstrated below for a LaSalle County farm, thereby illustrating how ARC-IC makes payments.
Benchmark Revenue Calculation for each Crop under ARC-IC
ARC-IC makes a payment when revenue from ARC-IC farms fall below .86 of benchmark revenue. Benchmark revenue for 2019 is based on yields from the farm for the years from 2013 to 2017, with the possibility of substitute yields if a farm yield is very low or the crop was not planted. These substitute yields differ across counties. As a result, the ARC-IC tool within the 2018 Farm Bill What-If Tool first asks the location of the farm.
Figure 1 shows the first input screen of the ARC-IC tool. In the example, the FSA farm is located in LaSalle County and has two program crops: corn and soybeans. Users can specify up to four program crops. The number of crops only need to include those crops grown in 2019. If soybeans were the only crop grown in 2019, then only one crop needs to be entered into the ARC-IC tool.

For each crop, yields must be entered for each year the crop was planted on the FSA farm (FSA has records of crops planted on FSA farms). The LaSalle County example assumes the entire FSA farm is in a corn-soybean rotation, with corn planted in 2013, 2015, and 2017 (see Figure 2). The 2013 farm yield was 226 bushels per acre, which was above 140.8 bushels per acre, 80% of T-yield, the substitute if the farm yield is below this value. For 2013, a 226.0 bushel per acre is used in benchmark calculations. Farm yields were 192 bushels per acre in 2015 and 247 bushels per acre in 2017, both above 80% of T-yield. As a result, 192 is used for the yield in 2015 and 247 is used for 2017.

For 2014 and 2016, corn was not planted on the FSA farm. When the crop is not planted, the county yield is used to calculate revenue for that year. As a result, 219.6 is used for the yield in 2014, and 230.3 is used for the yield in 2016. These county yields are trend adjusted and reflect a combination of irrigated and non-irrigated practices.
The yields used for each year are multiplied by the higher of the Market Year Average (MYA) price or the effective reference price. Except for 2013, all MYA prices for corn are below the $3.70 effective reference price. Prices used in revenue calculation are $4.46 for 2013 and $3.70 for all years after 2013 (see Figure 2).
Revenue for each year is found by multiplying yield time price. In 2013, a 226 yield is multiplied by a $4.46 price to result in a 2013 revenue of $1007.96 (see Figure 2). Revenue for the remaining years are $812.56 for 2014, $710.40 for 2015, $852.15 for 2016, and $913.90 for 2017.
Benchmark revenue for corn then equals the Olympic average of the revenues from 2013 to 2017. The high revenue of $1007.96 and low revenue of $710.40 are not included in the average. The $859.53 is the average of the three remaining yields (859.53 = (812.56 + 852.15 + 913.90) / 3).
A similar input screen exists for soybeans (see Figure 3). In the LaSalle County example, soybeans are planted in 2014 and 2016 with farm yields of 65 and 67 bushels per acre, respectively. Benchmark revenue for soybeans is $620.01 per acre.

ARC-IC Payments
Payments for 2019 ARC-IC will be illustrated for three cases: 1) all prevent plant, 2) only soybeans planted, and 3) corn and soybeans planted. These payments will be illustrated for the above LaSalle County farm using the payment screen in the ARC-IC tool (see Figure 4). In this screen, the user enters the following information for the 2019 year: acres planted, acres of prevent plant, farm yields, and MYA prices.

All Prevent Plant: In the case, no acres were planted to program crops and 80 acres were declared prevent planted for corn and 20 acres for soybeans. The distribution of corn and soybean prevent plant acres matter in the calculation of benchmark revenue. In this case, benchmark revenue is $811.63 per acre, which is a weighted average of the corn and soybean benchmark revenues: $811.63 = .80 x $859.53 corn benchmark revenue + .20 x $620.01 soybean benchmark revenue, where .8 means that 80% of the acres are planted to corn and 20% are planted to soybeans. Note that benchmark revenue would be higher at $859.53 if all acres had been corn prevent plant.
When all acres are prevented plant, there is zero revenue, and the maximum ARC-IC payment is made. The maximum payment is 10% of benchmark revenue or $81.16 per acre ($811.63 x .10). The ARC-IC tool reports payments per base acre, which requires multiplying the payment by .65. In this case, the payment is $52.75 per base acre ($81.16 ARC-IC payment x .65). The $52.75 is comparable to the per base acre payments from the ARC-CO/PLC tool, where payments are multiplied by a .85 factor.
The per base acre payment would be multiplied by total base acres on the farm. If there were 100 acres in the FSA farm, the payments would lead be $5,275 ($52.75 x 100 base acres). The distribution of base acres across crops does not matter in ARC-IC payment calculations.
Only Soybeans Planted: Figure 5 shows the case of soybeans being the only program crop being planted on the farm, with the yield being 50 bushels per acre. This could be the case when the farmer took prevented plant on corn and planted soybeans. In these cases, the fact that corn was prevented from being planted does not matter in ARC-IC calculations. Only the revenue on soybean acres matter. Moreover, the number of acres in soybeans does not matter. For the same soybean yield, the same ARC-IC payment per base acre results if 10 acres are planted, 50 acres are planted, or 100 acres of planted.
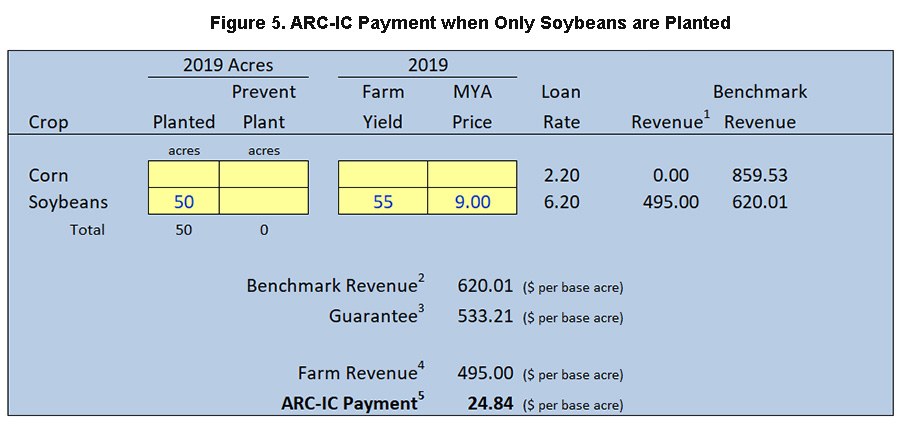
When only soybeans are planted, benchmark revenue for the farm is composed of only soybean benchmark revenue. The $620.01 benchmark revenue (see Figure 5) equals the soybean benchmark revenue of $620.01. Note that only yields for crops planted in 2019 matter in the ARC-IC calculation. In the example in Figure 5, previous corn yields and revenue do not impact ARC-IC payments, and therefore would not have to be entered into the tool.
The soybean yield for 2019 is 55 bushel per acre. The 2019 MYA price is estimated at $9.00 per bushel, the same as included in the January WASDE report. The $495 revenue (55 x 9) results in an ARC-IC payment of $24.84 per base acre. At this point, at $24.84 payment likely is larger than alternative ARC/PLC payments for corn and soybeans.
The soybean yield will influence ARC-IC payments:
- 60 bushel per acre yield has an ARC-IC payment of $0 per base
- 55 bushel per acre yield has an ARC-IC payment of $24.84 per base
- 50 bushel per acre yield has an ARC-IC payment of $40.30 per base
The maximum ARC-IC payment is $40.30, and all yields below 50 bushels per acre will generate the maximum payment
Corn and Soybeans Planted: Figure 6 shows the case of both corn and soybean planted, with 50% of the acres in corn and 50% of the acres in soybeans. In this case, the benchmark revenue is $739.77, which is 50% of the $859.53 corn benchmark revenue and 50% of the $620.01 soybean benchmark revenue.

In the example, yields are 195 bushels per acre for corn and 50 bushels per acre for soybeans. MYA prices are $3.85 per bushels for corn and $9.00 per bushel for soybeans. These yields and prices generate a payment of $23.29 per acre.
Commentary
All of the above three scenarios generate significant payments. These must be weighed against the payments in 2019 from ARC-CO and PLC. The Gardner ARC/PLC Payment Calculator, https://fd-tools.ncsa.illinois.edu, is useful in accessing expected payments for PLC and ARC-CO. At this point, there likely will not be PLC payments in 2019 (see farmdoc daily, January 22, 2020). ARC-CO could make payments, but yields will have to be low. More information on the potential size of ARC-CO payments will be available after the National Agricultural Statistical Service (NASS) released county yield on February 20. It is reasonable to expect that most Illinois counties will not have ARC-CO payments.
The commodity title choice will not only apply to the 2019 program year but the 2020 year as well. ARC-IC may not make payments in 2020. Of course, neither might ARC-CO and PLC.
An appropriate strategy is to identify those FSA farms with the potential for large ARC-IC payments in 2019. Those farms could be enrolled in ARC-IC. ARC-CO and PLC choices could then be used for farms without large ARC-IC payments.
Summary
Farmers who have all FSA farms that are prevented plant will find that ARC-IC will make larger payments than ARC-CO and PLC for 2019. Farmers will lower yields also could find ARC-IC will make larger payments than ARC-CO and PLC.
The ARC-IC tool will be revised in the future. In particular, revised t-yields will be entered into the calculator. Also, a tool that calculates ARC-IC payments from multiple FSA farms will be introduced.
Source: farmdocDAILY