Assessing Market Facilitation Payments in Hindsight and Implications for Future Policy
This article examines payments by the 2018 Market Facilitation Program (MFP) in the context of its objective to compensate US farms for tariff-related losses. Potential implications for future farm safety net policy are drawn, especially in light of a 2019 MFP 2.0 program with an expanded set of crops. Among potential implications are the likelihood of a 2020 MFP, a return to land retirement programs, and growing pressure to rewrite farm safety net programs.
Distribution of 2018 MFP Payments
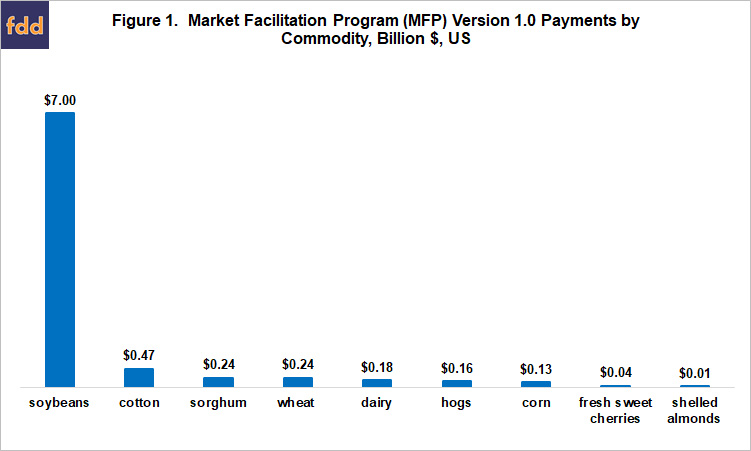
Payments by the 2018 MFP program (“MFP 1.0”) total $8.47 billion across 9 commodities (see Figure 1). Soybeans account for 85% of the payments. Source of these payments is a June 12, 2019 article by the American Farm Bureau Federation.
Change in Exports
Payments by MFP 1.0 are for tariff-related losses based on gross trade losses estimated using an international trade model benchmarked to 2017 trade flows (US Department of Agriculture (USDA), Office of the Chief Economist (OCE)). A principle concern is damage incurred by US farms from China’s imposition of tariffs on its imports of US farm products in response to tariffs imposed by the US on imports from China. The counter-tariffs raise the price of US farm exports, shifting China’s imports to other exporters, notably South America. Since supply is relatively fixed, especially in the short run; US exports will shift to importers normally supplied by South America. The shifting flow of trade means total US exports, not exports to China is the metric of interest.
Precise dating of the impact of China’s counter-tariffs on US farm prices is difficult. As carefully documented by Swanson, Coppess, and Schnitkey; on April 2, 2018, China implemented tariffs on $3 billion of U.S. imports, including some farm products, in response to the March 22 announcement of US tariffs on $50 billion or so of Chinese goods. Tariff-related announcements, implementations, and negotiations throughout April and May, including an April 4 announcement by China of a potential 25% import tariff on a list of 106 US products. The list included soybeans, corn, ethanol, sorghum, and beef. While prices moved up and down over this period, by the end of May corn and soybean prices were near March 1 levels.
Given this timeline, quantity of exports in the May 10, 2018 WASDE (World Agricultural Supply and Demand Estimates) is considered to largely predate impact of China’s counter-tariffs on exports of US farm products. Quantity of exports in the May 2018 WASDE are thus compared with quantity of exports in the latest (September 2019) WASDE. Fresh sweet cherries and shelled almonds are not included in this assessment as WASDE does not report on them.
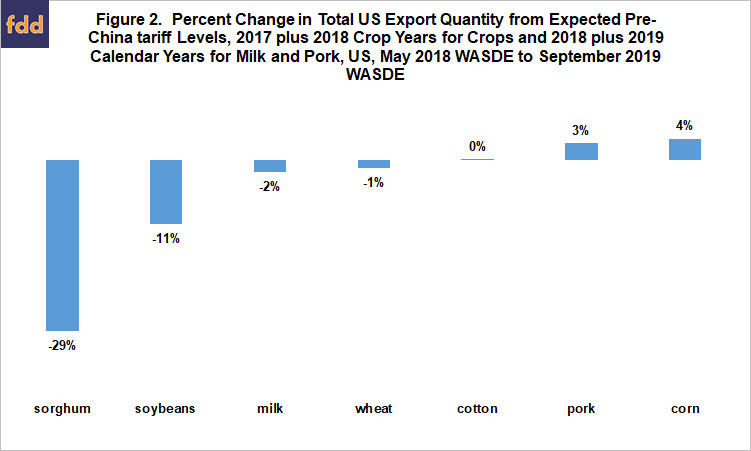
Figure 2 presents the change in total US exports for MFP 1.0 commodities after the release of the May 2018 WASDE. These changes will subsequently be referred to as post-tariff changes. For 5 of the 7 MFP 1.0 commodities in WASDE, post–tariff changes were less than 5% of total US exports reported in the May 2018 WASDE. Double digit declines in exports have however occurred for sorghum (-29%) and soybeans (-11%). Note, the change is calculated for combined exports over 2 crop or calendar years to capture the shifting forward of US exports to avoid tariffs. Such shifting was widely reported for US soybean exports to China.
MFP 1.0 Payments vs. Change in Exports
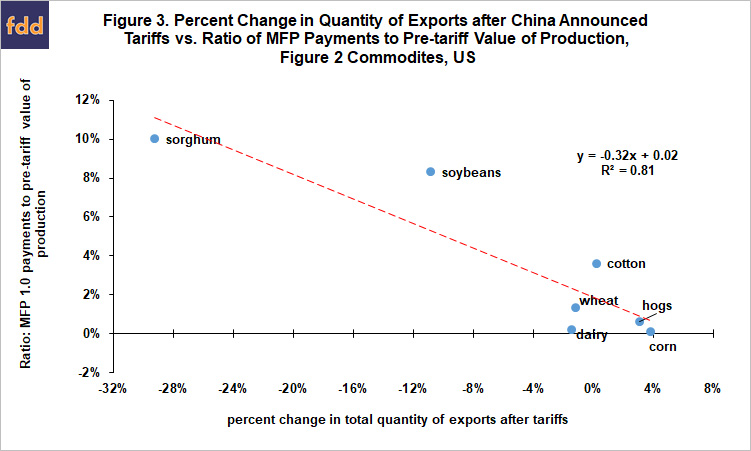
Percent deviation of exports from expected pre-tariff level closely matches up with MFP 1.0 payments when payments are expressed as a ratio to expected pre-tariff value of production (price times production) in the May 2018 WASDE (see Figure 3). This relationship is consistent with the methodology USDA, OCE used to estimate tariff damage and thus MFP 1.0 payments.
MFP 1.0 Payment vs. Change in Value of Production
Rationale for providing support to farms ultimately is not the impact of tariffs on farm exports but the negative impact of lower exports on price and hence value of US production. As Figure 4 illustrates, the relationship is notably weaker between percent change in value of production after tariffs and MFP 1.0 payments expressed relative to pre-tariff value of production. This finding is not surprising because exports are only one factor that impact value of production.
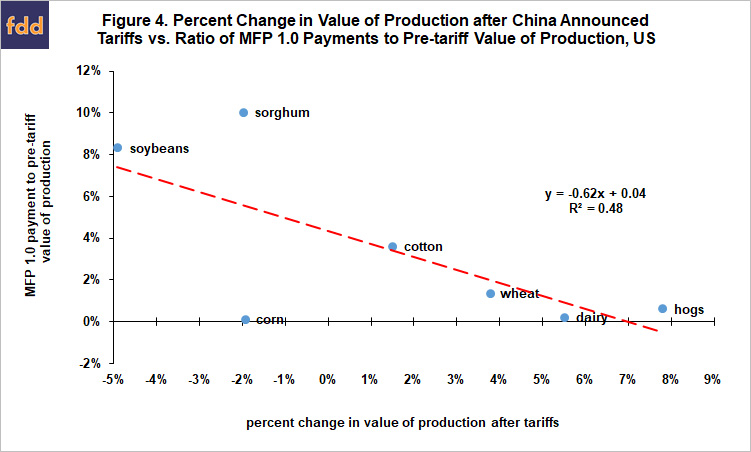
Sorghum and corn are notable because they deviate the most from the line in Figure 4. Removing them from Figure 4 increases R2 (explanatory power) to 94% (see data note 1). Several explanations exist for the outlier nature of sorghum and corn in Figure 4, but the most reasonable is cross-commodity impacts. Sorghum and corn are feed grain substitutes, but sorghum accounts for only 2% of the combined value of production of these two crops. Thus, changes in the price of corn matter more for changes in the price of sorghum than do changes in sorghum market factors, such as exports. Corn prices are also closely linked to soybean prices by competition for acres across the US. Thus, despite a 5% increase in corn exports over pre-tariff level (see Figure 2) largely due to drought in Argentina, corn price declined -5% from pre-tariff expectations as the soybean price decline of -15% from pre-tariff expectations spilled over into the corn market.
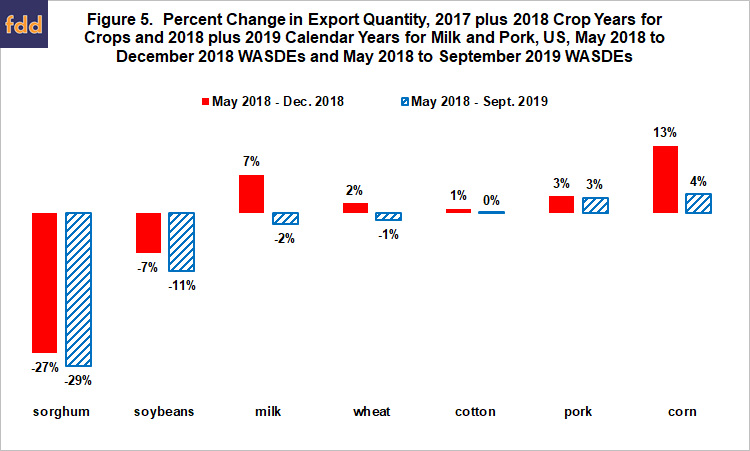
Deterioration in Exports over Time
Impact of tariffs on US exports is expected to increase over time as other countries increase production in response to higher prices and net returns. In the case of US corn and soybean exports in 2019, an additional negative factor is the recovery of production in Argentina from the severe drought that impacted their 2018 corn and soybean crops. WASDE forecasts for US exports have in general continued to decline since May 2018. Figure 5 illustrates this continuing decline using the May 2018, December 2018, and September 2019 WASDEs. The December 2018 WASDE roughly splits the period in half. Except for pork, exports decline more or increase less over the May 2018 – September 2019 WASDEs than over the May 2018 – December 2018 WASDEs. Increase in pork exports is the same over both periods. The continuing decline in exports is largest for milk and corn [9 percentage points: milk (7.0% – (-2%)); corn (13% – 4%)].
An Expanding MFP
Given the additional deterioration in US farm exports and likely cross-commodity effects, it is not surprising MFP 2.0 is larger than MFP 1.0. Forty different commodities are listed as eligible for MFP 2.0 payments (USDA, Farmers.Gov.) They include 16 commodities currently not listed as eligible for farm bill Title I commodity programs: alfalfa hay, almonds, cranberries, cultivated ginseng, dried beans, fresh grapes, fresh sweet cherries, hazelnuts, hogs, macadamia nuts, millet, pecans, pistachios, rye, triticale, and walnuts.
Summary Observations: Policy Implications
- MFP 3.0 in 2020 cannot be ruled out given the on-going decline in US farm exports, debate over small refinery exemptions from the ethanol mandate, and 2020 elections.
- Given the decline in US farm exports from various tariff wars amid growing farm production in other countries, notably in South America and the former Soviet Union, and with biofuels under strategic threat from a world-wide move to electric motor vehicles, a return to chronic, large US farm surpluses cannot be ruled out.
- The strategic threat from electric motor vehicles cannot be overstated. For the 2018 crop year, 5.3 billion bushels of corn were converted into ethanol. This use translates into 30.3 million acres of corn, or 9.5% of all US principal crop acres using the 2018 yield of 174 bushels per planted acre. At the very least, the US farm sector is swimming against the tide of electric motor vehicles.
- If chronic US surpluses take hold; sharply lower prices will result, bringing large spending on farm supports, particularly by the PLC (Price Loss Coverage) program.
- Large spending will bring pressure to change US farm safety net policy.
- A return to annual land set asides cannot be ruled out. They were eliminated in the 1996 farm bill, in large part due to a policy of expanding demand for US farm products that dates to the 1950s.
- Removal of acres via conservation programs is another option. Democratic Presidential candidate, Senator Elizabeth Warren, has proposed this option.
- In short, the US farm and agribusiness supply sector needs to consider the distinct possibility of a shrinking US farm production sector.
- Concurrently, history and political economics suggest supporters of any ad hoc policy will seek to transform ad hoc spending into annual program spending.
- Farm policy examples of annualizing ad hoc spending include (1) transforming the market loss program of the late 1990s / early 2000s into the Counter-Cyclical program by the 2002 farm bill and (2) routinely capitalizing ad hoc disaster assistance into expanded crop insurance offerings.
- It should thus be expected that attempts will be made to annualize MFP.
- The most straightforward way to annualize MFP is to raise support in the current farm safety net (higher ARC (Agriculture Risk Coverage) coverage, higher PLC reference prices, and enhancements to crop insurance).
- MFP 2.0 complicates this approach. It is the largest expansion in farm support since parity support was extended to almost all US farm commodities to stimulate production during World War II. Sixteen MFP 2.0 commodities are not currently eligible for farm bill Title I commodity programs:
- Expanding the safety net is a recent farm bill theme. The 2002 farm bill added a forestry title and extended target prices to soybeans and other oilseeds. The 2008 farm bill extended marketing loans and target prices to dry peas, lentils, and small and large chickpeas; added programs for horticultural and organic farms; authorized enterprise insurance, and added a Supplemental Disaster Assistance Program for livestock, honeybees, farm-raised catfish, orchard trees, and nursery stock. The 2014 farm bill permanently funded the latter. (Zulauf and Orden)
- Expanding Title I commodity programs could prompt discussion of a whole farm Title I program, or at least a whole crop farm program. The current 260 million base acres is 79% of the 330 million or so acres planted to all crops in the US annually. Hay acres account for 75% of the difference.
- Zulauf (forthcoming) argues an evolution to whole farm programs may be in its infant stage. The 2018 farm bill continues whole farm experiments in its commodity and crop insurance titles, specifically the ARC-IC (Agriculture Risk Coverage-Individual Farm) commodity program and Whole Farm Revenue Protection insurance contract. Both span recent farm bills, suggesting underlying support. ARC-IC in particular survived an attempt to remove it from the 2018 farm bill.
- Zulauf also analyses a whole farm program for major field crops. Payments are found to differ by year from current commodity payments for the 2014-2016 crops, suggesting current programs inappropriately compensate relative to total farm level losses. Moreover, total payments over the 3 crop years are smaller for the whole farm program. Primary reason is that it allows high revenue from some of the field crops to offset some of the low revenue from other field crops. Thus, moving to a whole farm program could pay for an expansion in supported commodities.
Data Notes
- Removing corn and sorghum from Figure 3 lowers its R2 (explanatory power) to 75%.
- Extra-long staple cotton is eligible for marketing loans but not ARC (Agriculture Risk Coverage) and PLC (Price Loss Coverage) payments.
References and Data Sources
American Farm Bureau Federation. “Mapping the $8.5 Billion in Trade Assistance: Reviewing MFP Payments by Commodity and State.” Market Intel, June 12, 2019. https://www.fb.org/market-intel/mapping-8.5-billion-in-trade-assistance
Swanson, K., J. Coppess and G. Schnitkey. “Trade Timeline and Corn and Soybean Prices.” farmdoc daily (8):141, Department of Agricultural and Consumer Economics, University of Illinois at Urbana-Champaign, July 31, 2018.
US Department of Agriculture, Farmers.Gov. “Market Facilitation Program.” August 30, 2019. https://www.farmers.gov/manage/mfp
US Department of Agriculture, Office of the Chief Economist. “Trade Damage Estimation for the Market Facilitation Program and Food Purchase and Distribution Program.” September 13, 2018. https://www.usda.gov/oce/trade/USDA_Trade_Methodology_Report_2018.pdf
US Department of Agriculture, Office of the Chief Economist. August 30, 2019. World Agricultural Supply and Demand Estimates: May 2018, December 2018, August 2018. https://www.usda.gov/oce/commodity/wasde/index.htm
Warren, Elizabeth. “A New Farm Economy.” September 2019. https://medium.com/@teamwarren/a-new-farm-economy-8db50fac0551
Zulauf, C. “Whole Farm Safety Net Programs: An Emerging US Farm Policy Evolution?” forthcoming, Renewable Agriculture and Food Systems.
Zulauf, Carl and David Orden. “80 Years of Farm Bills: Evolutionary Reform.” Choices: Online Magazine. Included in article theme, “Looking Ahead to the Next Farm Bill.” Agricultural and Applied Economics Association. 4th Quarter 2016. http://www.choicesmagazine.org.
Source: Krista Swanson, Gary Schnitkey, Jonathan Coppess, Nick Paulson and Carl Zulauf, Farmdocdaily