Bullish Acreage, Fund Short Combine to Dig Corn Out of Hole
 The 2020 June Stocks and Acreage reports from the USDA National Agricultural Statistics Service (NASS) were just what farmers needed. Expecting a modest fall of 1.8 million corn acres from the March survey, USDA instead shocked most in the trade with a nearly 5 million-acre drop to 92 million acres (ma). Adding fuel to the bullish fire was the lower-than-expected soybean planting number. Although soy planting was pegged at 10% larger than a year ago, the 83.825 ma projection was just 325,000 acres above the March intentions and 900,000 acres below expectations. Traders bought futures with reckless abandon, in essence ignoring what would turn out to be a mostly neutral to bearish June 1 stocks report.
CORN
USDA estimated 2020 corn planted acreage at 92.006 ma, compared to the March intentions of 96.99 ma and last year’s final 89.7 ma planting. That is down 3% from a year ago, but well below Dow Jones’ pre-report estimate of 95.2 ma. Harvested acres were estimated at 84.02 million compared to 81.3 ma a year ago. At the time of the survey, there were thought to be 2.239 million acres left to plant.
Some individual state changes of note were North Dakota, which was down 1.1 million acres from a year ago; Nebraska and Kansas each fell by 300,000 acres; Illinois, Iowa and Minnesota all jumped by 300,000 to 500,000 acres, with Ohio gaining 800,000 acres on 2019. Using a trend line yield of 178.5 bushels per acre (bpa), Tuesday’s 5-million-acre fall from March intentions figures over 800 million bushels (mb) less corn. Ultimately, the net effect will be a smaller drop than that, as feed and residual could result in a 500 mb to 600 mb lower ending stocks number for 2020-21. That could result in a much more manageable, but still bearish, 2020 ending stocks number of 2.8 bb to 2.9 bb.
June 1 corn stocks were estimated to be a higher-than-expected 5.220 billion bushels (bb), just slightly above March 2019 at 5.202 bb but down from 7.953 bb in March 2020. The March-May disappearance of 2.73 bb was 680 mb lower than a year ago. Much of that loss in demand is related to the COVID-19 lockdown measures (which affected corn for ethanol usage and livestock feeding) and the weak export pace versus a year ago.
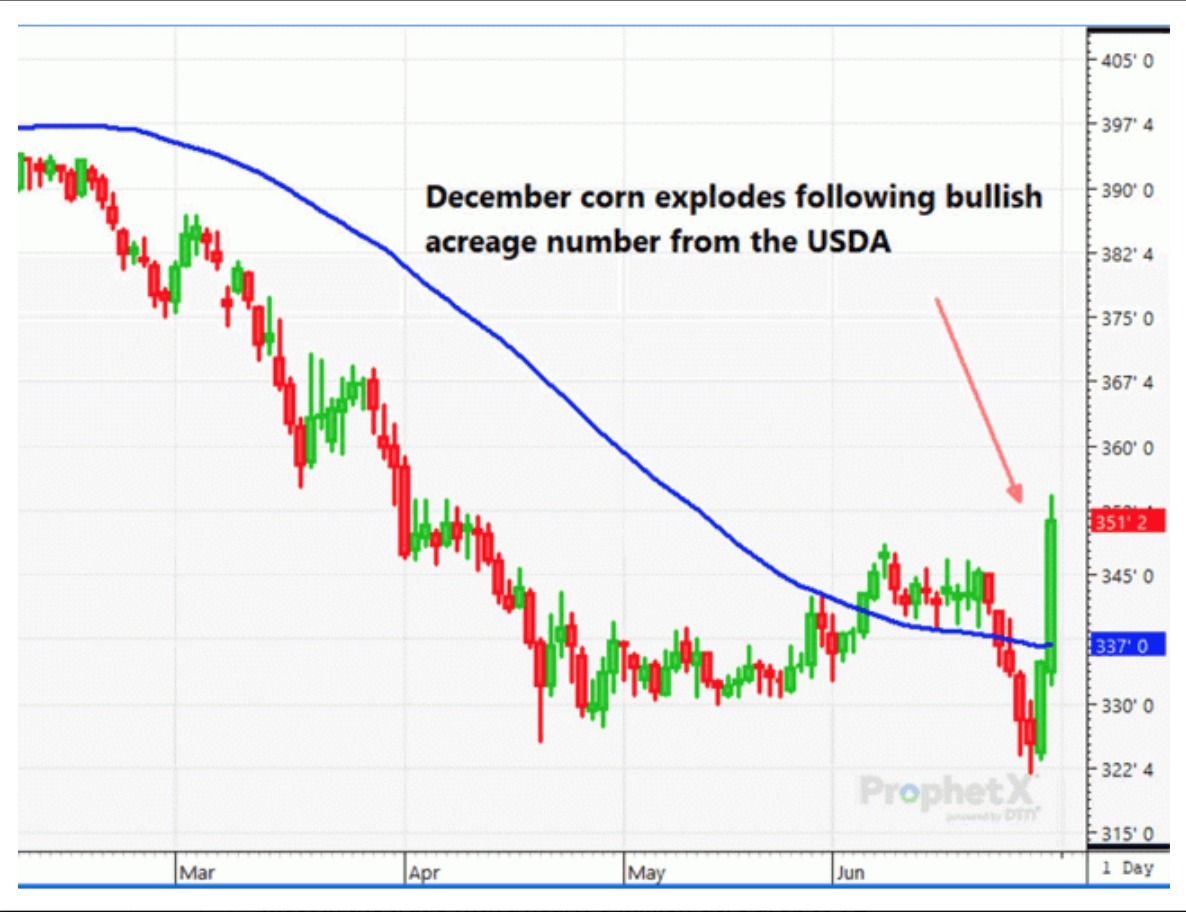
New-crop December corn, down 1/2 cent prior to the report, surged to a 15 3/4-cent higher close on report day.
SOYBEANS
While many in the trade were undoubtedly shocked by the lower-than-estimated corn acreage number, there was also some surprise that more of that acreage did not translate into higher-than-expected soybean acreage. Soybean planted acreage was revealed by NASS to be 83.825 ma — just 325,000 more than the March intentions. Pre-report expectations were for an 84.7-million-acre soy planting number. Even so, soy acreage was up a hefty 10% from a year ago. Harvested acreage was pegged at 83.02 ma versus just 74.9 ma in 2019. At the time of the June survey, USDA assumed that there were just over 12 million acres left to be planted. South Dakota had the largest gain in soy planting, amounting to 1.7 million acres versus 2019.
Soybean stocks as of June 1 came in very close to the Dow Jones survey estimate of 1.381 bb at 1.386 bb, which was down 22% from a year ago and compared to 2.253 bb in March. The 869-million-bushel March-through-May disappearance was 8% below a year ago. That is certainly the result of poor exports, along with COVID-19 demand impacts, as China is a long way from satisfying phase-one trade deal commitments. Also, until just recently, currency movements gave South America a price edge into China.
Even though commodity funds did not carry a large short soybean position into the report, the price reaction in beans would suggest that the trade was equally surprised that more lost corn acres did not move into soybeans. Soybean meal and oil, which funds were short, also rallied sharply as funds covered.
New-crop November beans, up 3 1/2 cents before the report, closed 20 3/4 cents higher for the day.
WHEAT
While there were few massive surprises in the NASS wheat numbers, wheat got some extra buying, as funds came in short all three markets. All-wheat acreage was revealed at a slightly less-than-expected 44.3 ma compared to the pre-report estimate of 44.7 ma and last year’s 45.2 ma. The planting number is the lowest wheat seeding since 1919. Of the total, 30.6 ma of winter wheat was just slightly under the 30.8 ma average estimate and compared to 31.16 ma last year. Spring wheat planting figured to be 12.2 ma, down 4%, and compared to pre-report expectations of 12.57 ma and the March intentions of 12.90 ma.
Wheat stocks, as of June 1, came in at 1.040 bb, about 61 mb above trade expectations and down 3% from March, which was 1.080 bb. The 372-million-bushel disappearance in March through May — from the March 2020’s 1.412 bb of stocks — was down 28% versus a year ago.
Wheat futures, following the mostly neutral to bearish report, rode on the coattails of corn, finishing 3 cents higher in Kansas City, 5 cents higher in Chicago and 10 cents higher in Minneapolis.
Dana Mantini can be reached at dana.mantini@dtn.com
Follow Dana Mantini on Twitter @mantini_r
Source: Dana Mantini, DTN