Comparing Livestock Productivity Since 1993
While not the most encompassing measure of crop productivity, yield, or production divided by land, is easy to compute. Research confirms its value as farms with consistently higher yields are found to be more profitable over time (Nivens, Kastens, and Dhuyvetter, 2002; and Sonka, Hornbaker, and Hudson, 1989). In addition, since land is a foundation input used in all crop production, percent change in yield provides insights across crops. In short, yield is a simple, useful metric. In contrast, commonly-used livestock productivity measures are specific to a species and usually to a particular part of the production process, such as pigs per litter. This article discusses a livestock productivity measure that is easy to compute and can be used to compare productivity across species. It is analogous to yield in construction. Specifically, livestock output is divided by the breeding stock that produces the animals that produce the output. The latter will be referred to as the foundation herd. By this measure, hogs clearly have the highest productivity gain over the last quarter century.
Annual Livestock Productivity Measures
Beef: (total dressed carcass weight of beef cattle slaughtered at commercial facilities) divided by (average of the beef cow inventory on January 1 and July 1 of the calendar year lagged by 2 years)
Broilers: (total ready-to-cook weight, of federally inspected broiler slaughter) divided by (broiler type layer hatching flock during a month averaged across the 12 calendar months of the same year)
Dairy: (total pounds of cow’s milk) divided by (average of the dairy cow inventory on January 1 and July 1 of the calendar year lagged by 2 years)
Eggs: (total table eggs laid) divided by (layer type layer hatching flock during a month averaged across the 12 calendar months of the same year)
Hogs: (total dressed carcass weight of hogs slaughtered at commercial facilities) divided by (average of the hog breeding herd inventory on June 1, September 1, and December 1 of the prior calendar year and March 1 of the same calendar year)
Sheep: (total dressed carcass weight of lambs and sheep slaughtered at commercial facilities) divided by (inventory of breeding ewes 1 year or older on January 1 of the prior calendar year)
The analysis spans 1993, the earliest calendar year for which the chicken hatching flock by broilers and layers is available, through 2018, the last completed calendar year. To dampen year-to-year variability and focus on long-term productivity, changes are computed between 5-year averages for 1993-1997 and 2014-2018.
Except for hogs, each denominator is only female animals to maintain consistency across species. For hogs, only breeding stock, which includes boars, is available for all years. If the share of boars in the hog breeding stock has changed little since 1993, then the change in productivity should be little affected by the use of hog breeding stock.
In constructing the productivity ratios, an important question is how long should be the time lag between the measure of foundation herd and the measure of output. The biology of production varies by species and various lags are possible for a given species, especially since data are available for only a limited number of months for all foundation herd variables except for the hatching flock. Focus of this article is changes in productivity. Different, reasonable lags impact changes in productivity less than the level of productivity for an individual year. Alternative lags were examined. The storyline discussed below remains the same even though the changes in productivity varied slightly for the different lags.
Meat production data are from USDA (US Department of Agriculture), Economics Research Service, which obtains the data from USDA, NASS (National Agricultural Statistics Service) reports. USDA, NASS Quick Stats is the source for egg and milk production, as well as for animal inventory numbers except for the chicken hatching flock from 1993 to 2007. The latter are from USDA, NASS, Chicken and Eggs – Annual Summary. See data notes 1-4 for additional features of the productivity measures.
Livestock Productivity
Productivity of hog production stands out. It was 68% higher in 2014-2018 than in 1993-1997 (see Figure 1). Next highest were dairy and broilers at 44% and 43%, respectively. Productivity gains for beef and eggs are 17% and 13%, respectively. In assessing the productivity of beef, it is important to keep in mind that calves from dairy cows that are not retained for the dairy herd are often fed out for beef and culled dairy cows are sold for beef. If the share of beef coming from dairy cows and calves has changed since 1993, it could affect the change in productivity of beef production.
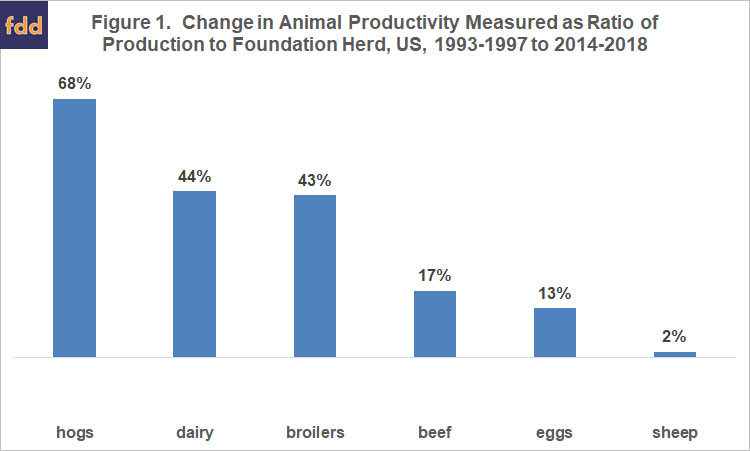
Productivity increased only 2% for sheep. Non-commercial slaughter is much larger in sheep than other species due to demand from non-traditional markets. This slaughter is a moving target and difficult to assess. It is not captured in the productivity ratio, and thus could explain at least some of the small gain in sheep productivity.
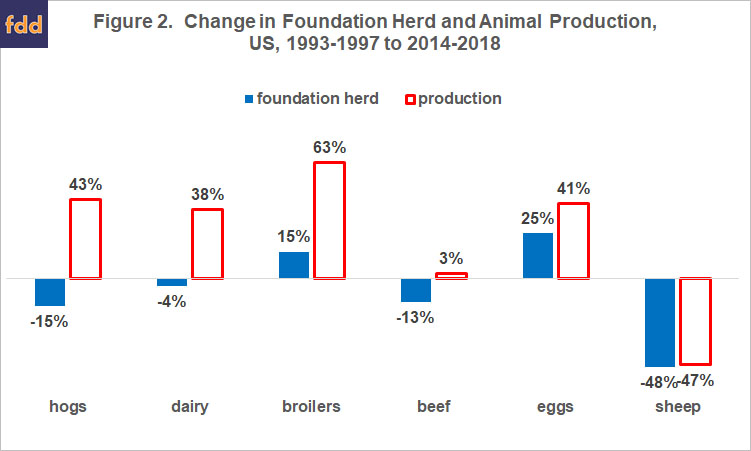
At its simplest, productivity increases when more output is produced with the same foundation herd or when the same output is produced with a smaller foundation herd. Dairy illustrates the former as more production is coming from a foundation herd that has changed little (see Figure 2). Beef illustrates the latter as about the same production is coming from a smaller foundation herd. And, while production increased more for broilers than hogs (63% vs. 43%), productivity increased more for hogs as its foundation herd declined -15% vs. a +15% increase for broilers.
A key difference across beef, hog, and sheep is change in offspring per female animal. To illustrate, saved pigs per litter rose +30%, from 8.25 in the March 1993 Hogs and Pigs report to 10.70 in the March 2019 report. Using numbers from Cattle, ratio of the calf crop during the prior calendar year to cows and heifers that had calved as of January 1 was 0.89 in 1993 vs. 0.90 in 2019, a +1% gain. Sheep and Goats reported lambs per 100 ewes in 1993 as 102 vs. 107 in 2019, a +5% gain.
Comparison to Crop Yields
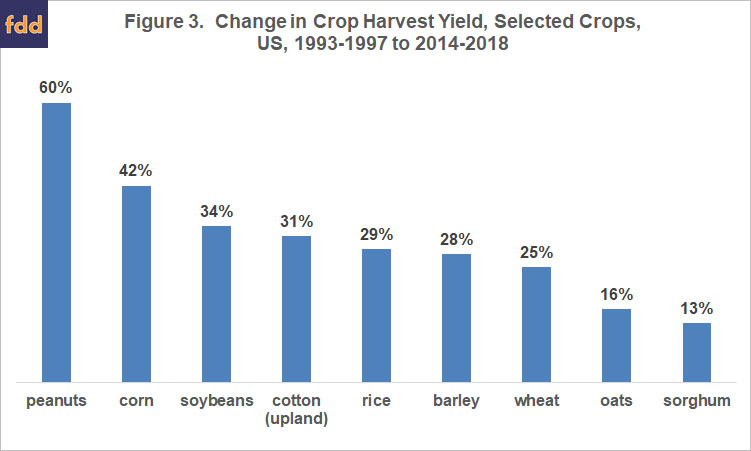
Caution is needed in comparing changes in this livestock productivity measure with changes in crop yields, in part because livestock production is a flow process while crop production is more akin to a stop-action process involving a time-defined planting-to-harvest period. However, the comparison does provide one perspective. Gains in hog productivity exceeded the increase in harvest yield of 9 large acreage field crops over the same period (see Figure 3). The gain in dairy and broiler productivity is on par with the increase in corn yields and is exceeded only by the increase in peanut yields.
Summary Observations
- A simple-to-compute measure of livestock productivity that allows comparison across livestock species is presented and discussed. Specifically, production is divided by the herd that produces the animals that produce the output. The latter is called the foundation herd.
- By this measure, hogs had the largest increase in productivity over the last quarter century: 68% vs. the next highest increases of 44% and 43% for dairy and broilers. Productivity gains for beef, eggs, and sheep lag.
- Any ratio measure calls attention to its components, in this case, the important role foundation herd plays in livestock productivity. A smaller foundation herd is a key contributor to the large increase in hog productivity and in particular its advantage over broiler and dairy productivity gains. This observation implies more attention should be paid to the role of the foundation herd in livestock productivity at all levels, from individual operations to the sector.
Data Notes
(1) Commercial facilities include federally inspected and other slaughter plants.
(2) Production of beef, pork, and lamb and mutton are based on packers’ dressed weight.
(3) Production does not include on-farm slaughter.
(4) Beef and dairy cow inventory was not reported for July 1, 2013 and July 1, 2016. Thus, the 2015 and 2018 productivity ratios for beef and dairy are based only on January 1 inventory numbers.
References and Data Sources
Nivens, H. D., T. L. Kastens, and K. C. Dhuyvetter. 2002. “Payoffs to Farm Management: How Important is Crop Marketing?” Journal of Agricultural and Applied Economics. 34(April): 193-204.
Sonka, S. T., R. H. Hornbaker, and M. A. Hudson. 1989. “Managerial Performance and Income Variability for a Sample of Illinois Cash Grain Producers.” North Central Journal of Agricultural Economics 11(January): 39-47.
US Department of Agriculture, Economic Research Service. April 2019. Data Products: Livestock & Meat Domestic Data, Red Meat and Poultry Production. https://www.ers.usda.gov/data-products/livestock-meat-domestic-data/
US Department of Agriculture, National Agricultural Statistics Service. April 2019. Quick Stats. http://quickstats.nass.usda.gov/
US Department of Agriculture, National Agricultural Statistics Service. 1993-2007. Chicken and Eggs – Annual Summary. https://usda.library.cornell.edu/concern/publications/fb494842n?locale=en
US Department of Agriculture, National Agricultural Statistics Service. February 1993 and February 2019. Cattle. https://usda.library.cornell.edu/concern/publications/h702q636h
US Department of Agriculture, National Agricultural Statistics Service. March 1993 and March 2019. Hogs and Pigs. https://usda.library.cornell.edu/concern/publications/rj430453j
US Department of Agriculture, National Agricultural Statistics Service. February 1993 and February 2019. Sheep and Goats. https://usda.library.cornell.edu/concern/publications/000000018
Source: Carl Zulauf, Farmdocdaily