Corn and Soybeans, COVID-19, and the U.S. Farm Safety Net
A key input into estimates of economic damage resulting from the COVID-19 pandemic is the role of payments by current farm safety net programs. This article illustrates their importance using a price estimate on May 5 to evaluate COVID-19 impacts on revenue and safety net payments for corn and soybeans. Combined corn and soybean revenue is projected down by $8 billion across the United States, a decline of 9%. These estimates are for crop produced in 2020, and do not include losses on 2019 crop, or potential losses on crops after 2020. Estimates, obviously, are preliminary as prices could change. Moreover, economic damages will be farm specific, and will depend on many factors.
Overview of 2020 Corn and Soybean Safety Net
The farm safety net for corn and soybeans consists of crop insurance, commodity programs, and marketing loans. Figures 1 and 2 provide key safety net values for 2020 corn and soybeans, respectively. Objective is to understand broad market impact of COVID-19 on US corn and soybeans; thus, the values are for the US. FSA recently reported that US farms elected PLC (Price Loss Coverage) for 76% of corn base and ARC-CO (Agricultural Risk Coverage – County) for 80% of soybean base (farmdoc daily, April 30, 2020). Given these high shares, Figures 1 and 2 contain only values for PLC for corn and ARC-CO for soybeans. Projected insurance price is for states having a final purchase date of March 15.


Futures price of December 2020 corn and November 2020 soybeans is as of early morning trading, Tuesday, May 5, 2020. This price is used to estimate expected insurance indemnities as of May 5. The corn price is14% below corn’s projected insurance price and the soybean price is 8% below soybean’s projected insurance price. Making the assumption as of early May that harvest yield equals linear trendline projected yield, no insurance indemnity payment is currently estimated for the highest individual farm insurance coverage level of 85%. Lower coverage levels also would not have payments. County revenue insurance would have an expected payment since its coverage level is 90%. RP (individual farm revenue insurance with the Harvest Price Option) is used in this analysis. RP is the most commonly purchased insurance product for US corn and soybeans. See the data note for a discussion of trendline yields.
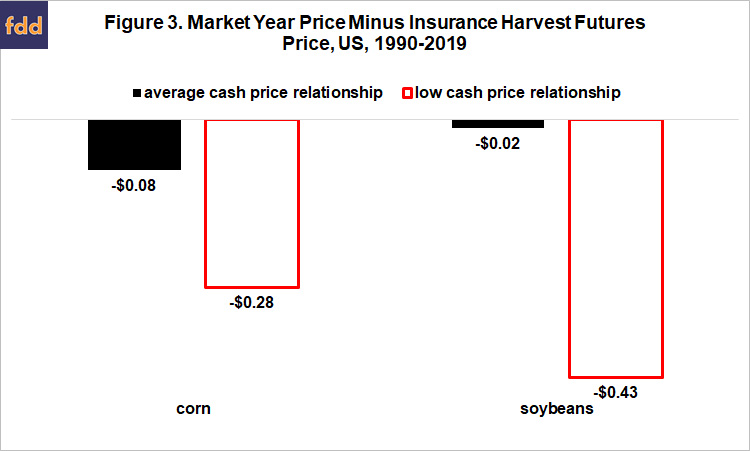
The May 5 futures price is also used to estimate the 2020 market year average price (MYAP), which in turn is used to estimate ARC-CO, PLC, and marketing loan payments. Two estimates are made of 2020 MYAP. One uses the average difference between MYAP and December corn / November soybean futures price during crop insurance’s harvest discovery period for the 1990-2019 crops. The other uses the average of the 10 years with the most negative difference. These are the 10 years with lowest MYAP relative to the harvest futures price. The second estimate is made because cash prices have been more affected than futures prices because the COVID-19 pandemic has destroyed demand and increased stock levels. Cash prices are typically weaker than futures prices when stocks are larger than when they are smaller. Figure 4 contains the price differences. Their wide variation for a given crop underscores the importance of considering cash market impacts. Using the Figure 3 values, 2020 MYAP estimates for corn as of early morning May 5, 2020 are $3.24 and $3.04 (futures price of $3.32 plus -$0.08 and -$0.28, respectively). Both are well below corn’s $3.70 PLC reference price, implying sizable expected PLC payments for 2020 corn. Estimates for the soybean 2020 MYAP are $8.41 and $8.00 (futures price of $8.43 plus -$0.02 and -$0.43). ARC-CO’s coverage value is 86% or, stated alternatively, its deductible is 14%. Estimated soybean MYAP prices are -6% and -11% below the ARC-CO benchmark price of $8.98. Yield variation at the county level will likely cause some ARC-CO payments at these levels of price declines but it is too early in the growing season to assume any yield other than trendline yield for the US. No ARC-CO payments for soybeans are thus expected at present.
2020 Corn and Soybean Revenue Estimates
Revenue estimates are made using the procedures discussed in the preceding section for the February 2020 insurance price discovery period and for May 5, 2020. The February estimate is an estimate that pre-dates the market impacts of COVID-19. The May 5 estimate includes the private market estimate of supply and demand impacts of COVID-19. Table 1 contains the revenue estimates by source. Corn revenue per planted acre at harvest has declined by -16% to -21% (from $667 to $560 or $526). The estimates for soybeans are -8% to -13% (from $444 to $408 or $388). The only farm safety net payment currently expected is from PLC for corn at $54 to $93 per base acre. The PLC payment estimate includes the 15% reduction for non-payment acres and 7% budget sequestration reduction. Multiplying these per base acre payments by the 72 million corn base acres in PLC for the 2019 crop year implies total PLC payments to corn of $3.9 to $6.7 billion for the 2020 crop. It is also important to note that, with another 1% to 2% decline in December 2020 corn futures price, 85% RP will begin to make payments at trendline yield.

Revenue Loss for US Corn and Soybeans
As noted earlier, payments by ARC-CO and PLC are payments to a FSA farm using historical base acres, not to a specific planted crop. Therefore, revenue estimates need to be made at the FSA level, or in the case of this analysis at the US level. US farms indicated they intended to plant 97 million acres to corn and 83.5 million acres to soybeans in 2002 as of the March 31, 2020 Prospective Plantings report from USDA. USDA, FSA reported that were 95.4 million acres of corn base and 54.0 million acres of soybean base signed up for the 2019 crop year. PLC accounted for 72.1 million corn base acres while ARC-CO accounted for 43.0 million soybean base acres.
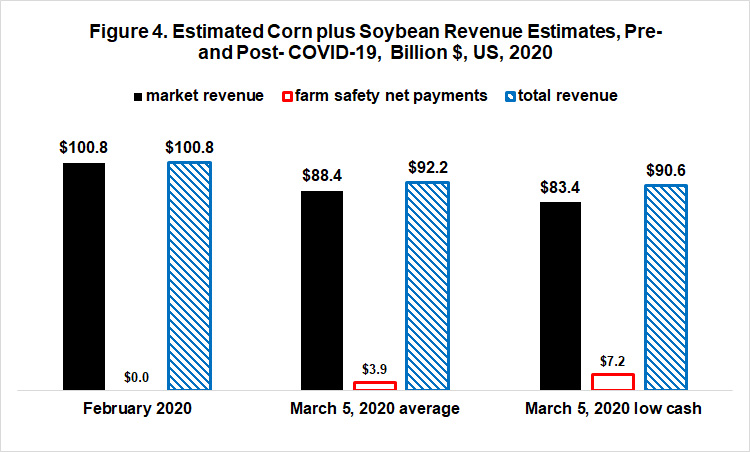
Multiplying the per acre market revenue estimates in Table 1 by planting intention acre and summing across corn and soybeans results in total market revenue estimates of $100.8 billion as of February 2020, declining to $83.4 to $88.4 billion as of May 5, 2020 (see Figure 4). This decline is partially offset by PLC corn payments of $3.9 in the case of the average cash price situation. In the low cash price situation, farm safety net payments by PLC for corn total $6.7 billion. Also in the low cash price situation, ARC-CO makes payments for corn of $339 million while PLC makes payments of $99 million for soybeans (see Date Note 2 for details). Sum of these three payments is $7.2 billion. While losses remain considerable, payments by the existing farm safety net as of May 5, 2020 cover 31% and 41% of the losses, respectively. Revenue losses become $8.5 billion to $10.2 billion.
Summary Observations
Deepening concern exists over the demand destruction caused by the COVID-19 pandemic.
In estimating the damage that US crop agriculture has suffered, it is important to take into account the payments made by existing farm safety net programs.
Payments by the Agricultural Risk Coverage and Price Loss Coverage program are made on historical base acres, not currently planted acres. Thus, they are a payment to the farm, not a payment to the crop. Nevertheless, it is a payment that offsets the lower prices caused by the COVID-19 pandemic.
This study takes both of these considerations into account for corn and soybeans, the two largest acreage field crops in the US.
Using December 2020 corn and November 2020 soybean futures on early morning trade of May 5, 2020, payments by ARC-CO and PLC for corn and soybeans are estimated to range from $3.9 to $7.2 billion, depending on whether you expect the relationship between cash and futures price to be average or weaker than average. This range illustrates the importance of following what happens to cash prices, not just futures prices.
After accounting for estimated payments from existing farm safety net programs, losses to corn and soybeans are estimated to be between $8.5 and $10.2 billion. These losses are current estimates of those associated with the 2020 crop year. They do not include losses associated with the 2019 crop, or for future crop years associated with lingering effects of the COVID-19 pandemic.
Note that estimated safety net payments do not include payments from the third commodity program option, Agricultural Risk Coverage – Individual farm, nor do they include payments to other covered program commodities for which corn or soybeans was planted on their base acres .It is also important to keep in mind that even small further declines in corn prices will result in payments by PLC and by crop insurance for those acres insured at coverage levels of 85% or higher, assuming harvested yields equal trendline yields. These payments for the same price decline will offset some of the losses due to deductibles in the current safety net programs.
The implication of all the considerations mentioned into the three preceding points is that estimates of damage not covered by existing farm safety net programs will not be very accurate until more accurate estimates of actual 2020 yields and program payments become available. This typically does not start to emerge for corn and soybeans until the September crop reports. To make payments based on estimated damage before then is to incur substantial risk that payments will either be too large or too small.
Moreover, revenue loss can only be appropriately measured at the aggregate level of all US program commodities. Stated alternatively, it is not appropriate to talk about revenue damage for an individual crop given that commodity programs make payment on historical base acres not planted acres.
Data Notes
- Trendline yield for 2020 corn and soybeans is estimated by regressing a linear time trend variable on observed US yield per planted acre for 1990-2019. For corn, the intercept is 110.6 bushels / planted acre and linear trend is +2.01 bushels / planted acre per year. Explanatory power of the equation is 72%. Planted acres equal total acres planted to corn minus acres harvested for corn silage. Projected 2020 US corn yield is 173 bushels / planted acre. For soybeans, the intercept is 32.5 bushels / planted acre and linear trend is +0.52 bushels / planted acre per year. Explanatory power is 75%. Projected 2020 US soybean yield is 48.5 bushels / planted acre.
- The low cash price situation for corn is $3.04, which is -18% below the ARC-CO benchmark price of $3.70. This results in a corn ARC-CO payment estimate of $19.03 per acre. Total ARC-CO payments for corn are estimated at $339 million, given the 17.6 million corn base acres elected into ARC-CO for the 2019 crop year. The low cash price situation for soybeans is $8.00, which is below the PLC effective reference price for soybeans of $8.40. This results in a soybean PLC payment estimate of $12.96 per soybean base acre. Total PLC payments for soybeans are estimated at $99 million, given the 7.6 million soybean base acres elected into PLC for the 2019 crop year.
References and Data Sources
Coppess, J., N. Paulson, K. Swanson, G. Schnitkey and C. Zulauf. “Farm Program Update: ARC/PLC Enrollment.” farmdoc daily (10):80, Department of Agricultural and Consumer Economics, University of Illinois at Urbana-Champaign, April 30, 2020.
US Department of Agriculture, Farm Service Agency. 2020. ARC/PLC Program. April. Available online: https://www.fsa.U.S.da.gov/programs-and-services/arcplc_program/index
US Department of Agriculture, National Agricultural Statistics Service. 2020. QuickStats. April. http://quickstats.nass.U.S.da.gov/
US Department of Agriculture, National Agricultural Statistics Service. 2020. Prospective Plantings. March 31. https://www.nass.usda.gov/Publications/Todays_Reports/reports/pspl0320.pdf
US Department of Agriculture, Risk Management Agency. 2020. Summary of Business. April. http://www.rma.U.S.da.gov/
Source: Carl Zulauf, Gary Schnitkey, Nick Paulson, Krista Swanson and Jonathan Coppess, Farmdocdaily