Disappointing Wheat Prices Headed into 2020
Winter wheat planting has started for many producers across the county. While the 2020 acreage debate won’t reach a fever pitch until sometime in March, wheat acres are a critical first mover. Wheat acres, of course, have been in a downward spiral in recent years, pushing more corn and soybean into production. What does wheat have in store for 2020? This week’s post considers another year of disappointing wheat prices.
Wheat Prices
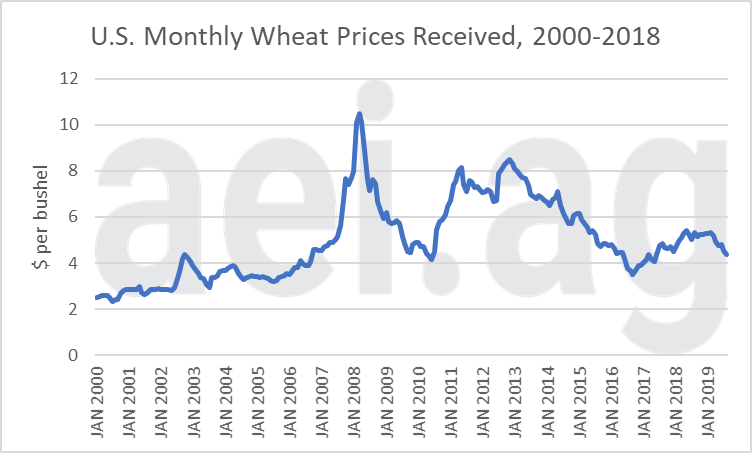
Figure 1 shows the monthly average wheat prices received by producers since January 2000. Wheat prices in 2019 have stayed above $4 per bushel but have trended lower since the beginning of the year. Just a few years ago, wheat price in 2016 fell below $4 per bushel for six months. Of course, wheat acres tumbled during this timeframe, losing nearly 9 million acres of production (16%) from 2015 to 2017.
Last year, we noted wheat prices had observed a welcome recovery since 2016. Prices last fall, for example, reached $5.31 in August. Prices have trended lower since then and, most recently hit a disappointing $4.35 in August 2019. That is nearly a $1 per bushel, or 18%, decline in prices in a year.
Prior to the farm economy boom, wheat prices were regularly below $4 per bushel. Over the last decade, however, sub-$4.00 was much less common, occurring in only 6 months. Similarly, monthly average wheat prices at or below the most recent price ($4.35) have occurred in only 14 months over the last ten years. This is all to say that current wheat prices are quite low.

Figure 1. Monthly U.S. Average Wheat Price Received, January 2000 – July 2019. Data Source: USDA NASS.
Wheat/Corn Price Ratio
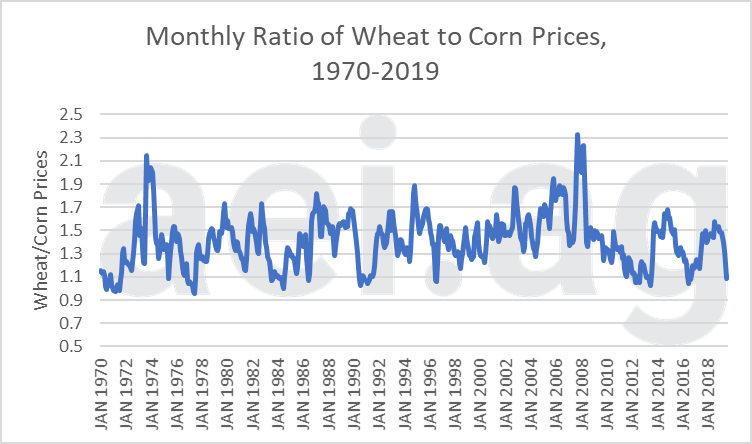
Another helpful way of considering wheat prices is relative to corn. While wheat prices are low (figure 1), how are they relative to alternatives? Figure 2 shows the monthly wheat/corn price ratio since 1970. Over nearly 50 years of data, the ratio has an average of 1.4. Last August, the ratio was nearly 1.6, but recently plummeted to 1.1. Historically, a wheat/corn ratio below 1.1 roughly has only occurred 9% of the time.
Taking figures 1 and 2 together, the implications are that wheat prices fallen since last fall (figure 1) and have fallen relative to corn prices (figure 2). Both of these will likely limit producers’ enthusiasm toward wheat in 2020.

Figure 2. Monthly Ratio of Wheat to Corn Prices, 1970- August 2019. Data Source: USDA NASS.
Wheat Crop Insurance Price
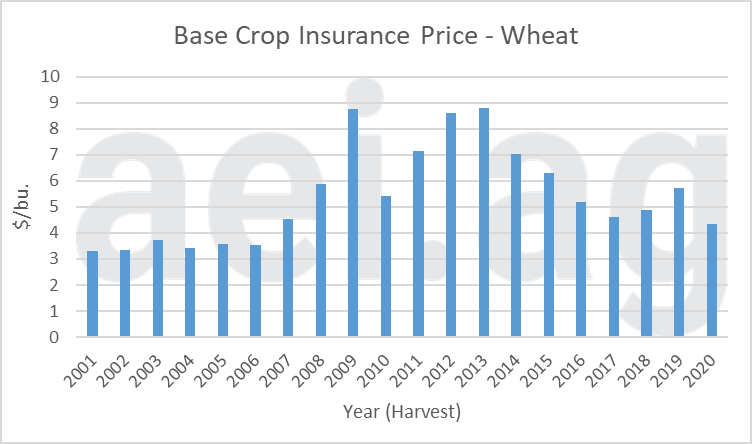
Figure 3 shows the annual base crop insurance price for wheat since 2000. For 2020, the price was set at $4.35. This is $1.39 per bushel less than in 2018. Furthermore, it is the lowest crop insurance base price since 2006. Again, this is another disappointing price signal for wheat producers.

Figure 3. Annual Base Crop Insurance Price for Wheat, 2000 – 2020.
Wrapping it Up
In 2019, the U.S. planted 45.6 million acres, the fewest since records began in 1919. Headed into 2020, the price signals – actual prices, relative prices, and crop insurance prices – are all less favorable than a year ago. Additionally, the price signals are among the lowest in recent years.
A key question for 2020 will be wheat acres; will acres fall below 45 million in 2020? While many factors impact planting decisions – rotations, planting conditions, etc.- prices are always an important factor. The implication of fewer wheat acres would be additional acres of alternative crops, especially corn or soybeans.
Click here to subscribe to AEI’s Weekly Insights and receive our free, in-depth articles in your inbox every Monday morning.
But wait, there’s more: click here to visit the archive of our articles – hundreds of them – and to browse by topic. We hope you will continue the conversation with us on Twitter and Facebook.
Source: David Widmar, Agricultural Economic Insights
