Farm Capital Expenditures Stabilizing?
It’s no great secret that modern farming requires significant amounts of capital. Capital expenditures made by farm businesses can be quite volatile, typically rising as incomes increase and falling as they decrease. This volatility creates lots of challenges for the businesses that supply capital goods to the sector as well as the farmers themselves. Faced with a stock of capital assets that depreciate over time, it is a significant challenge to decide when to make new investment decisions or even make replacement decisions. This is particularly true when debt is used to finance capital investment. Farmers and businesses, in general, are nervous to be caught paying for large capital investments should income fall.
Farm Capital Expenditures Remain Depressed
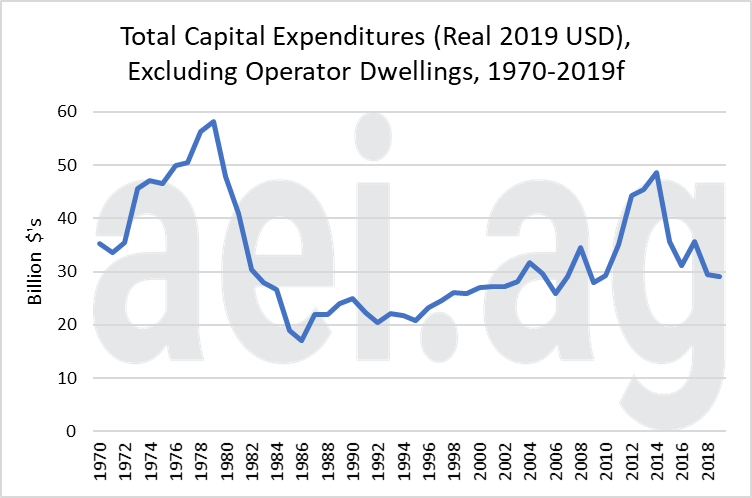
In 2019, the USDA expects farm capital expenditures will amount to $30 billion (Figure 1). There are a few ways to look at this level. On one hand, it is a dramatic decline from the nearly $50 billion seen in 2014. On the other hand, today’s levels are back to those experienced in the early 2000s, when farm incomes were more stable. One question is whether we should expect to see capital expenditures climb much higher or stabilize at near the current levels?

Figure 1. Real (2019 USD) Capital Expenditures, Excluding Operator Dwellings, 1970-2019f.
If you look at the longer history in Figure 1, you can clearly observe the two peaks in farm capital expenditures. The first in the late 1970s and the later in the early 2010s. From the 1979 peak, capital expenditures fell for 7 consecutive years. In the current situation, capital expenditures fell for 3 years, rebounded slightly and then continued lower again.
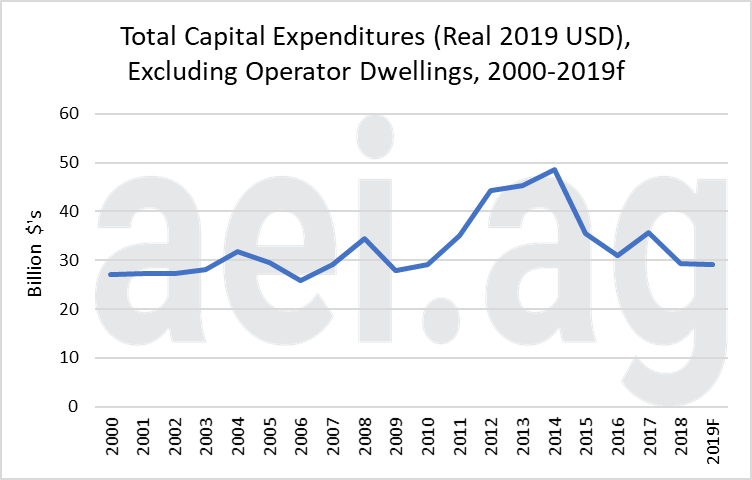
Although I am a fan of looking at a long time horizon, often it is useful to also take a shorter look at the same data. Figure 2 shows the exact same data as Figure 1 but changes the time span covered by the graph. This is a good example of how the scales of the graph can quickly change our perception of the data. In Figure 1, the compression of the data along the time (horizontal) axis makes the height of the graph appear much more dramatic. However, the data shown are exactly the same. Both show that capital expenditures rose from $30 billion to just short of $50 billion and have now fallen back to the $30 billion level. From Figure 2 it is more apparent that capital expenditures are back to roughly the same levels seen before the most recent farm income boom/bust cycle.

Figure 2. Real (2019 USD) Capital Expenditures, Excluding Operator Dwellings, 2000-2019f.
The Income Capital Expenditure Relationship
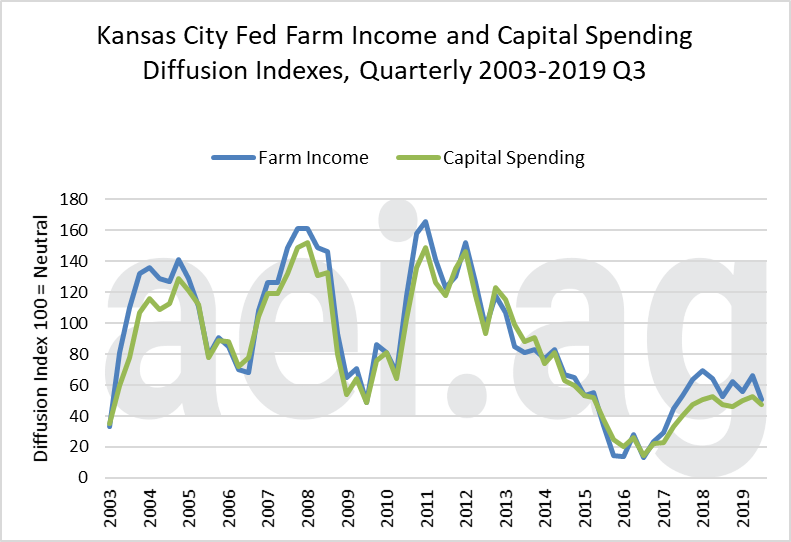
In order to understand the farm economy, the Kansas City Federal Reserve conducts a quarterly ag credit survey of agricultural bankers. In their survey, they ask lenders to indicate whether they think that farm income and capital spending is higher, lower, or the same in the same quarter last year. They then calculate a diffusion index by subtracting the proportion that state lower from the proportion that state higher and adding 100. The result is an index that is neutral at 100, shows expansion above 100, and contraction below 100. For instance, if 30% of the respondents indicate lower capital spending, 10% higher, and 60% unchanged, the diffusion index value would be 80 (10-30+100=80). The diffusion indices for farm income and capital expenditures are shown in Figure 2.

Figure 3. Kansas City Federal Reserve Farm Income and Capital Spending Diffusion Indexes, Quarterly 2003-2019q3.
At present both the farm income and capital spending indices are in contraction territory. However, it is important to note that bankers seem to have noticed a significant increase in both since 2016. It is apparent from Figure 3 that the bankers see a strong relationship between changes in farm capital spending and farm income.
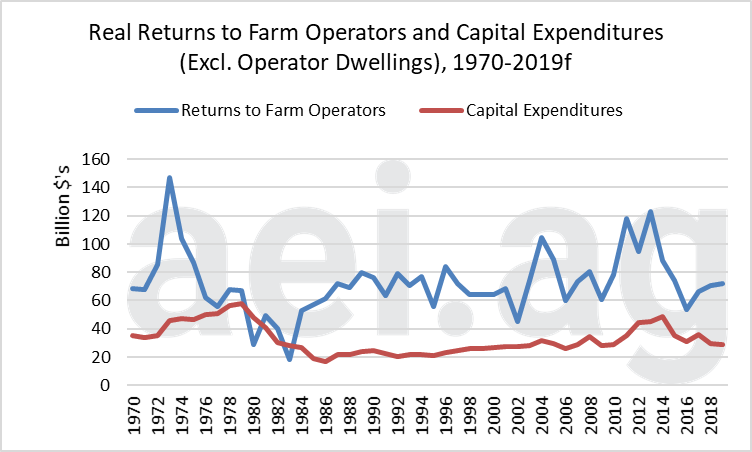
The relationship between the returns to farm operators and capital expenditures (excluding operator dwellings) is shown in Figure 4. From this graph, it is more difficult to see the same close relationship between farm incomes and capital expenditures. A regression analysis of the two series indicates a significant and positive relationship between the return to operators and capital expenditures, but it is important to point out that the relationship is complex and likely includes lag effects.

Figure 4. Real (2019 USD) Returns to Operators and Capital Expenditures (Excluding Operator Dwellings), 1970-2019f.
Wrapping it Up
Like the rest of the farm economy, capital expenditures have been on a wild ride. At present, it appears that they have stabilized around the $30 billion level. This is roughly the same level that they were at in the years leading up to the farm income boom.
Farm incomes have an important impact on farm capital expenditures. While the bankers see the impacts almost instantaneously, the aggregate data suggest a slightly more complex relationship. Regardless, the relationship is logical, and it would appear there is good evidence that the relationship is positive. To answer the question posed at the start, it is my expectation that capital expenditures will likely stabilize at these levels. That answer, though, is clearly dependent upon farm incomes stabilizing at present levels. If farm incomes begin to swing substantially, changes should again be expected.
Source: Brent Gloy, Agricultural Economic Insights (aei)
