Farm Loan Delinquencies Higher in 2018, Remain Historically Low
After several years of persistently low net farm income, collapsing levels of working capital, and rising debt, there has been growing concern about the overall health of the farm economy. A helpful measure is farm loan delinquency rates, which is published by the Kansas City Federal Reserve Bank.
Two categories of farm loan delinquency data are published, non-real estate and real estate.
Non-Real Estate Farm Loans
Figure 1 shows the share of non-real estate farm loans that are delinquent going back to 1987. More specifically, these data are the fourth-quarter of each year (in yellow). The black line shows the 32-year average value for this measure, 2.26%.
At the end of 2018, delinquencies rates for non-real estate farm loans reached 1.84%. After reaching a low of 0.7% in 2014, this measure has trended higher over the last five years. Furthermore, current levels are at the highest levels since 2011.
Considering the data since 1987 provides some helpful perspective. First, current levels (1.84%) remain below the 32-year average (2.26%). Furthermore, current levels are well below the uptick in delinquencies observed in 2009, which peaked at 3.15%. Finally, the delinquencies rate on non-real estate farm loans remains lower than levels experienced during the 1990s and early 2000s. This is all to say that even though the delinquency rate has steadily increased over the last five years, the increase was from historically low levels.
Recently, we have seen many measures of the farm economy focusing only on the last few years of data. These measures often show an unfavorable trend, like the sharp uptick observed in figure 1 since 2014. Often these are misleading as a more extended data series would provide more context and perspective. Consider the conclusions and headlines had figure 1 only included data since 2014.
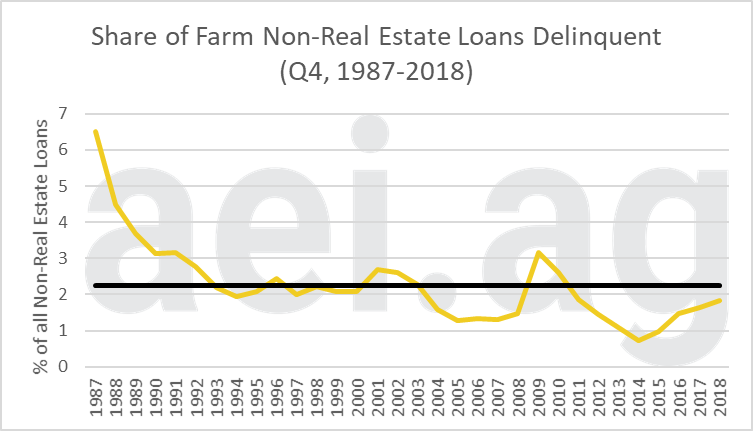
Figure 1. Share of Farm Non-Real Estate Loans Delinquent, Q4, 1987-2018. Average: 2.26% (in black). Data Source: Kansas City Federal Reserve Bank’s Agricultural Finance Databook.
While a larger share of non-real estate farm loans are classified as delinquent, it’s also worth considering the size, or volume, these loans represent (Figure 2). At the low in 2014, delinquency non-real estate farm loans had a collective value of $500 million. This reached more than $1 billion in 2016 but has recently declined. In 2018, the value of these loans were $860 million.
It’s worth pointing out that while the change in the share of delinquent non-real estate farm loans since 2014 has more than doubled (0.72% to 1.84%), the volume has increased by less than double ($530 million to $860 million).
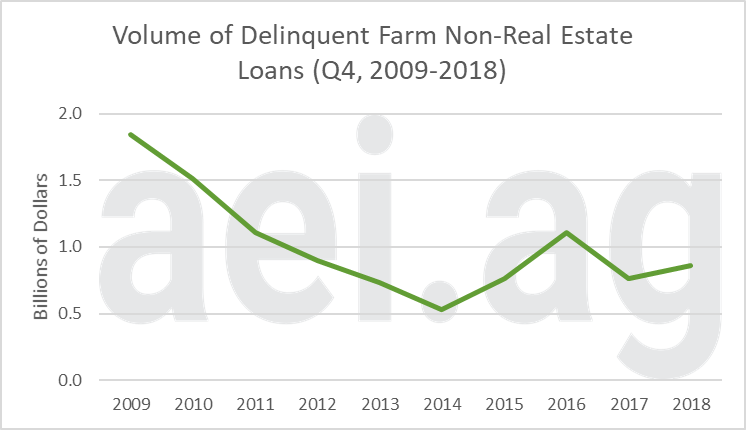
Figure 2. Volume of Delinquent Farm Non-Real Estate Loans, Q4, 2009-2018. Data Source: Kansas City Federal Reserve Bank’s Agricultural Finance Databook.
Real Estate Farm Loans
Figure 3 shows the share of farm real estate loans that are delinquent. These data, collected since 1991, have an average value of 2.3%.
At the end of 2018, the share of farm real estate loan delinquent was 2.11%. Similar to Figure 1, this measure remains below the long-run average and levels observed throughout most of the 1990s and early 2000s.
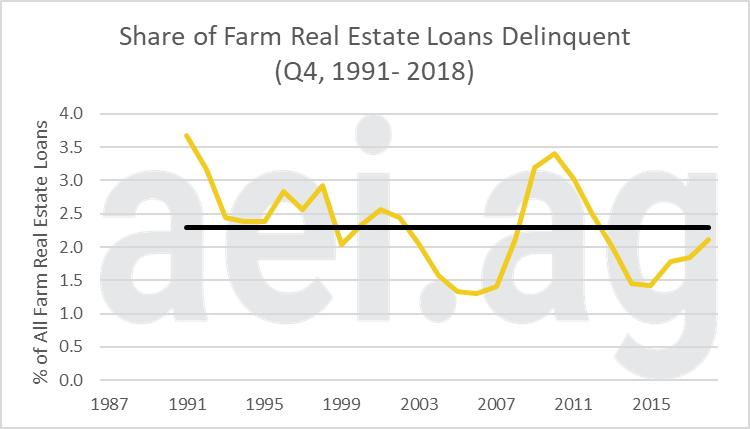
Figure 3. Share of Farm Real Estate Loans Delinquent, Q4, 1991-2018. Average: 2.30% (in black). Data Source: Kansas City Federal Reserve Bank’s Agricultural Finance Databook.
Figure 4 shows the volume of farm real estate loans classified as delinquent. The trend here has been different than that of non-real estate loans. Specifically, the value of delinquent farm real estate loans at the end of 2019 was $2.17 billion, similar to that observed in 2009 and 2010. Keep in mind that in 2009 and 2010 the share of farm real estate farm loans delinquent was much higher than today (3.4% in 2010 vs. 2.11% in 2018). This has occurred as farm real estate debt has pushed higher in recent years.
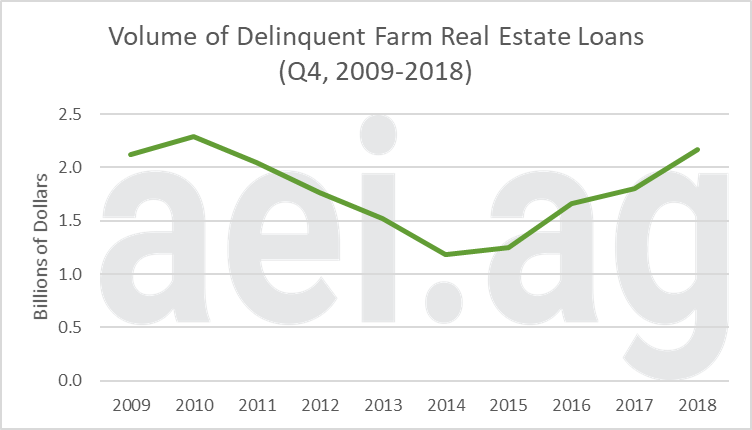
Figure 4. Volume of Delinquent Farm Real Estate Loans, Q4, 2009-2018. Data Source: Kansas City Federal Reserve Bank’s Agricultural Finance Databook.
Wrapping it Up
Farm loan delinquencies provide an important measure into the overall well-being of the farm economy. This measure has trended higher over the last five years. While the upward trend is unfavorable, historical data provides context. Most notably, current levels remain below the long-run averages and levels frequently observed during the 1990s and early 2000s.
Looking ahead, delinquencies will be important to monitor if net farm income remains low. As Brent pointed out recently, working capital is precariously low. The farm economy needs significant improvement before stabilization and moderation can occur. In the meantime, be cautious of any farm economy data that only shows a few years of recent data. Historical context is key.
Like what you read? Click here to subscribe to AEI’s Weekly Insights and receive our free, in-depth articles in your inbox every Monday morning. But wait, there’s more: click here to visit the archive of our articles – hundreds of them – and to browse by topic. We hope you will continue the conversation with us on Twitter and Facebook.
Source: David Widmar, Agricultural Economic Insights