Farmer Sentiment Weakens Amid Increasing Marketing Risk Concerns
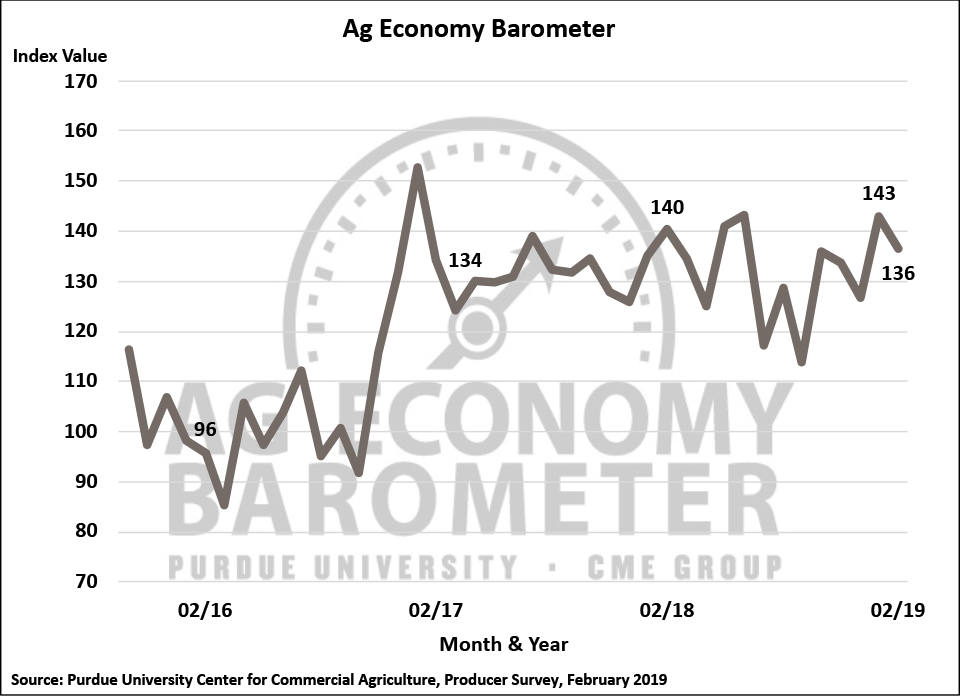
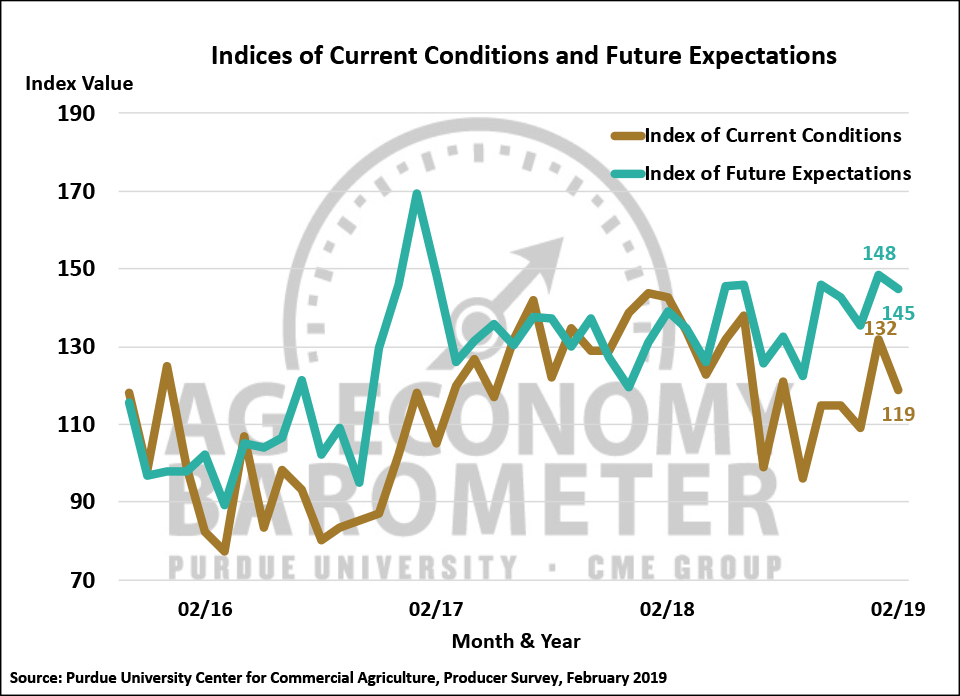
 The Ag Economy Barometer weakened slightly in February, declining 7 points to a reading of 136 compared to 143 a month earlier. The modest decline puts the barometer back near the levels observed in October and November 2018 and just 4 points below the level of February 2018. The downward shift in the barometer was primarily the result of weakness in producers’ perception of current economic conditions on their farms as the Index of Current Conditions fell from a reading of 132 in January to 119 in February. Producers’ expectations regarding future conditions also weakened, but the decline was just 3 points, falling from 148 in January to 145 in February.
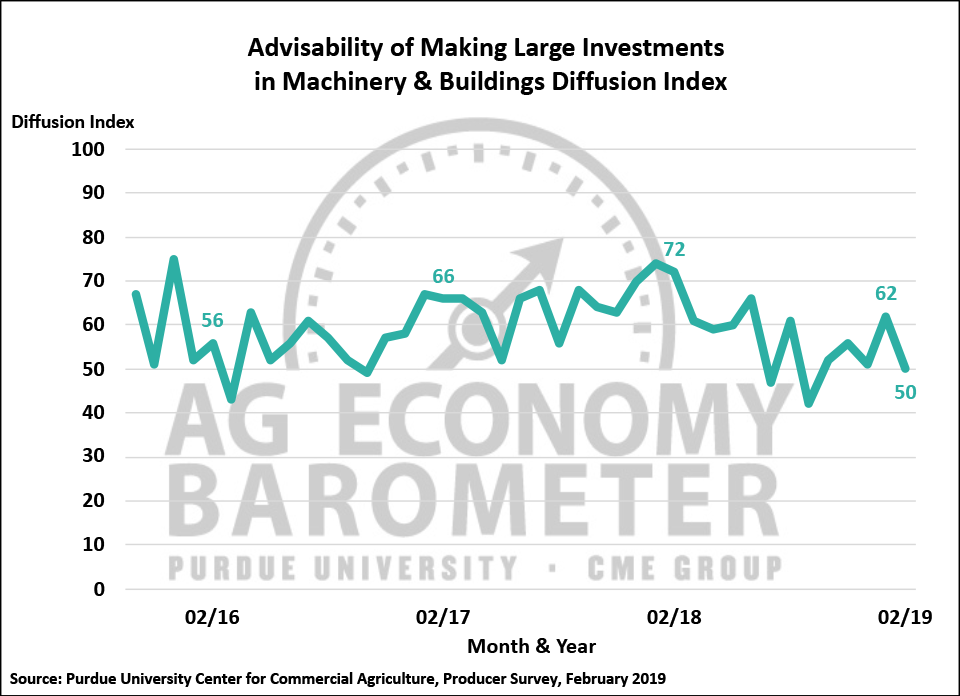
The Large Farm Investment Index declined in February to a reading of 50 compared to 62 in January. The decline put the index back near its December 2018 level of 51, suggesting the positive impact of the second round of MFP payments on producer attitudes eroded quickly. Although producers’ perspective on making large investments fluctuates from month-to-month, when examined from a longer-term perspective it appears that farmers’ attitude towards making investments in machinery and buildings has deteriorated since the tariff battles erupted last summer. Looking at the Large Farm Investment Index from January-June 2018, before the impact of the trade disputes disrupted commodity markets, it averaged a reading of 65. In contrast, the investment index averaged just 53 from July 2018 through February 2019.
Although producers were less inclined to view investments in machinery and buildings favorably in February compared to January, it did not spill over into their views on farmland values. The percentage of respondents expecting lower farmland values five years from now on the February survey was 47 percent, virtually unchanged from January’s reading of 48 percent. At the same time, the percentage of farmers expecting lower farmland values 5 years ahead actually drifted lower to 11 percent from 13 percent in January, leaving longer-term sentiment regarding farmland values virtually unchanged when compared to a month earlier. Interestingly, when asked to evaluate farmland as an investment, the percentage of farmers rating it as a good investment rose for the 4th month in a row to 68 percent. The percentage of farmers rating farmland as a poor investment declined for the 3rd month in a row to just 15 percent, which is the lowest percentage recorded since we first posed this question in fall 2015.
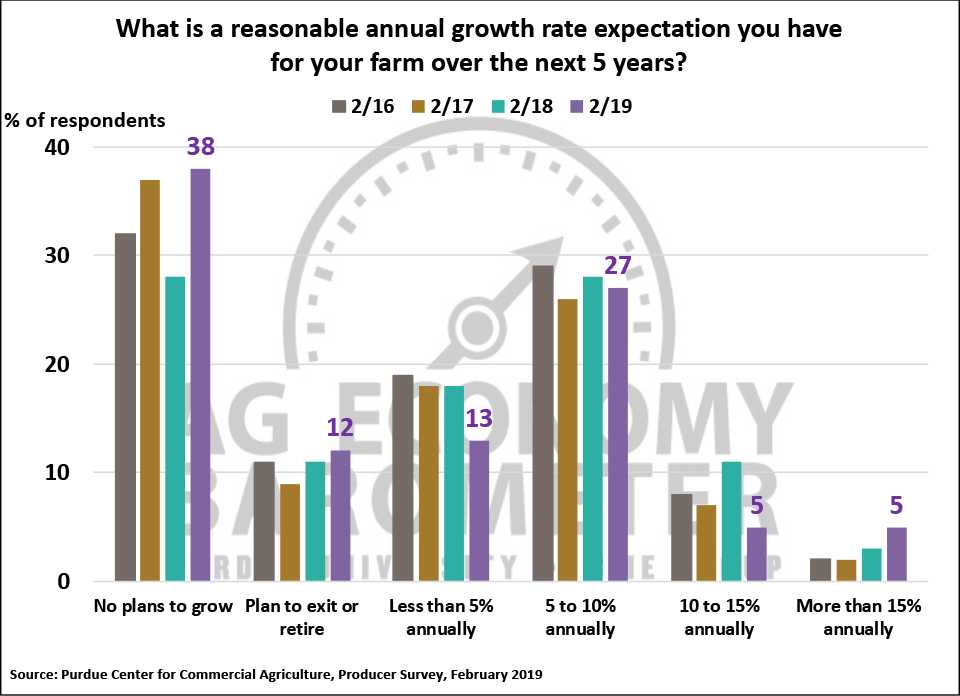
Each year we ask farmers what their longer run plans are with respect to growth of their farm operation. Compared to a year earlier there are some interesting differences. For example, on the 2019 survey 50 percent of the respondents said that they either have no plans for their operation to grow in size or that they actually plan to reduce the size of their operation as they plan to exit or retire from production agriculture. This was a noticeable increase compared to a year earlier when 39 percent of respondents indicated that they have no plans to grow or actually plan to reduce their operations’ size. At the same time the percentage of producers that anticipate their farm growing by 5 percent or more per year decreased to 37 percent from 42 percent in 2018. The shift in our surveys towards a larger portion of respondents indicating their farm business is not expected to increase in size could be related to the fact that some farms are experiencing financial stress. For example, in January 25 percent of the farms in our sample indicated that they were going have a larger operating loan in 2018 than in 2019. When we followed up and asked why their operating loan would be larger, 27 percent responded that it was because they had to carryover unpaid operating debt from prior years.
Farmers became a bit more optimistic about the future of agricultural exports on the February survey as the percentage of farmers expecting ag exports to increase over the next 5 years rose from 63 percent to 67 percent and the percentage expecting exports to decline shifted marginally from 7 percent to 6 percent. The combination of producers expecting exports to increase with those expecting a decrease actually suggests that farmers’ overall expectations about future ag exports was the most positive it’s been since we first posed this question in May 2017.
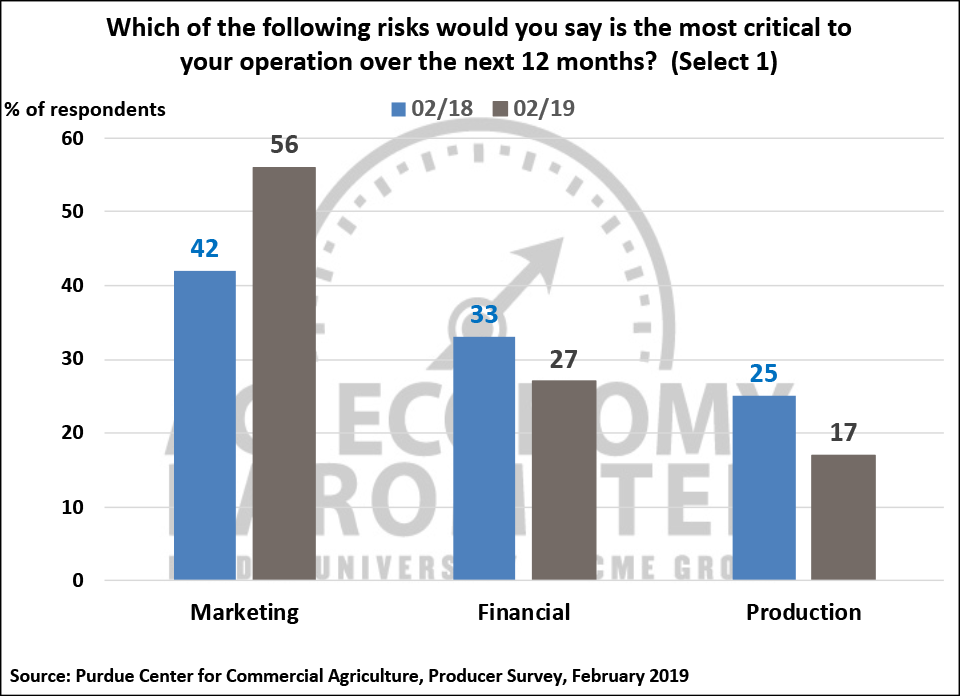
Although farmers’ perspective regarding prospects for future growth in agricultural exports improved, they remain concerned about marketing and price risk in agricultural markets. When asked if marketing, financial or production risk was the most critical to their farm operation, respondents overwhelmingly said marketing risk (56 percent) was the most critical followed by financial (27 percent) and production (17 percent) risks. Compared to results from February 2018, the last time this question was posed, farmers in February 2019 were more concerned about marketing risk and less concerned about financial and production risk. For example, the percentage of respondents ranking marketing risk on top climbed 14 points this year vs. 2018 whereas those choosing financial risk declined 6 points to 27 percent and those choosing production risk declined 8 points to 17 percent.
Looking ahead to spring planting season, we asked producers who planted soybeans in 2018 what their plans are with respect to soybean acreage in 2019. Over two-thirds of soybean growers said their acreage would be the same as in 2018 while 9 percent said they plan to increase their soybean acreage. However, 23 percent of growers in our survey indicated they plan to reduce their soybean acreage compared to last year. When we followed up and asked growers that plan to reduce soybean acreage, by how much they plan to reduce their soybean acreage, two-thirds (66 percent) of them said they plan to reduce acreage by more than 10 percent. This compares to a response rate to this same question in January 2019 (59 percent) and November 2018 (60 percent).
The USDA is working towards implementation of the 2018 Farm Bill, which was passed in December. To learn more about producers’ perspective on one of the key aspects of the new Farm Bill, we asked producers that planted corn in 2018 which commodity income support program they think they will choose when sign-up becomes available. Unsurprisingly, since many producers are still unfamiliar with the Farm Bill’s details, a majority (56 percent) of producers said they were uncertain regarding which program they will choose. However, it was interesting to note that among producers that have given program sign-up some consideration, producers were almost evenly split in their choice of the ARC-County (23 percent) and PLC (21 percent) programs. These results suggest there will be much more interest in the PLC program among U.S. corn farmers than under the 2014 Farm Bill. To help put this in perspective, over 90 percent of corn base acres were enrolled in the ARC-County program under the 2014 Farm Bill.
Wrapping Up
Sentiment among agricultural producers weakened slightly in February compared to a month earlier. The decline was primarily the result of a fall in the producers’ Index of Current Conditions, which fell 13 points below its January reading. The decline in producers’ perception of current conditions on their farms spilled over into their evaluation of whether or not now is a good time to make large investments in machinery and buildings on their farms as the Large Farm Investment Index dropped 12 points below a month earlier to a reading of 50. Compared to responses from a year ago, fewer farms expect their farming operation to grow in the future, which could be a sign of increasing financial stress among farms in our survey.
At the same time, however, there were some signs of optimism among U.S. farmers. Sentiment regarding longer-term prospects for farmland values actually improved compared to January and the percentage of farmers that said they view farmland as a good long-term investment rose for the fourth month in a row while the percentage of farmers that view farmland as a poor investment declined for the third month in a row. Agricultural producers also became more optimistic about U.S. agricultural exports growth prospects.
The mixture of negative and positive views regarding current and futures economic conditions is indicative of the amount of uncertainty about near-term and future prospects among producers. An indication of this could be seen when producers were queried about risks they face. When asked what risk was most critical to their farming operation, producers overwhelmingly chose marketing risk over both financial and production risk, which is indicative of their uncertainty regarding the commodity price outlook.
Source: Purdue University