Disclaimer
Pro Ag Management, Inc.* (collectively with its corporate affiliates, “ProAg®”) is a managing general agency representing several risk bearing insurance companies, including Producers Agriculture Insurance Company and U.S. Specialty Insurance Company. Insurance policies are obligations of the issuing insurance company, are not obligations or deposits of or guaranteed by any bank and are not insured by the Federal Deposit Insurance Corporation. ProAg is a subsidiary of Producers Ag Insurance Group®, Inc. and a member of the Tokio Marine HCC group of companies.
The insurance products described on this website may not be a complete list of all products offered and may not be offered in all states. The provided information does not amend, or otherwise affect, the terms and conditions of any insurance policy issued by ProAg or any of its subsidiaries; always refer to the policy provisions. Actual coverages will vary based on the terms and conditions of the policy issued.
* Doing business as Pro Ag Insurance Services, Inc. in California, CA Entity License #0F34212.
Non-Discrimination Policy
ProAg is an equal opportunity provider. In accordance with Federal law and U.S. Department of Agriculture (USDA) civil rights regulations and policies, the USDA, its Agencies, offices, and employees, and institutions participating in or administering USDA programs are prohibited from discriminating on the basis of race, color, national origin, religion, sex, disability, age, marital status, family/parental status, income derived from a public assistance program, political beliefs, or reprisal or retaliation for prior civil rights activity, in any program or activity conducted or funded by USDA (not all bases apply to all programs).
To File a Program Complaint. If you wish to file a Civil Rights program complaint of discrimination, complete the USDA Program Discrimination Complaint Form, found online at www.usda.gov/about-usda/general-information/staff-offices/office-assistant-secretary-civil-rights/how-file-program-discrimination-complaint, or at any USDA office, or call (866) 632-9992 to request the form. You may also write a letter containing all of the information requested in the form. Send your completed complaint form or letter by mail to the U.S. Department of Agriculture, Director, Center for Civil Rights Enforcement, 1400 Independence Avenue, S.W., Washington, D.C. 20250-9410 or email at program.intake@usda.gov.
Persons with Disabilities. Persons with disabilities who require alternative means of communication for program information (e.g., Braille, large print, audiotape, American Sign Language, etc.) should contact the responsible State or local Agency that administers the program or USDA’s TARGET Center at (202) 690-0443 (voice and TDD) or contact USDA through the Federal Relay Service at (800) 877-8339. Additionally, program information may be made available in languages other than English.
Persons with disabilities, who wish to file a program complaint, please see information above on how to contact the Department by mail directly or by email.
USDA is an equal opportunity provider, employer, and lender. ProAg is an equal opportunity provider and employer. Full Privacy & Non-Discrimination Statements
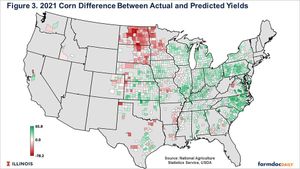 USDA’s National Agriculture Statistics Service (NASS) released county yield data for 2021. This data provides indicators of the chance of some crop-insurance or government payment programs, though it’s important to note it is not the actual yield data used to calculate Agriculture Risk Coverage (ARC-CO), Supplemental Coverage (SCO) or the Enhanced Coverage Option (ECO), just an indicator. Specific to this study and the state of Illinois, the data revealed Illinois farmers should not expect ARC-CO payments at the county level for corn or soybeans. Though the Enhanced Coverage Option (ECO) at the 95% coverage level could make payments for corn eligible in some Northwest Illinois counties. ECO-95% could also pay in several Illinois counties on soybeans.
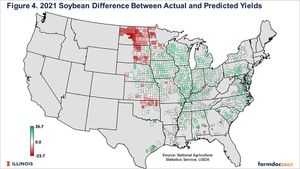 From a national level, the drought sweeping the Great Plains is likely to result in payments in some counties in those states. Many counties in North Dakota, South Dakota and Minnesota, with actual yields dropping below 60% of expected, may be eligible for ARC-CO, SCO and ECO payments. However, SCO and ECO payment amounts are not known as USDA’s Risk Management Agency (RMA) has not released their county yield data. The data used in this study will differ from NASS.