How Sensitive Are Trend Yield Projections for U.S. Corn to the Starting Year of the Estimation Period?
The start of summer means the market begins focusing on U.S. corn yield prospects. The first step in any effort to project corn yields is estimating trend yield. Trend estimation is the “launch point” when forecasting yields during the summer: favorable conditions push projections above trend and unfavorable conditions push projections below trend. A variety of issues are presented when estimating corn trend yields and these have been investigated in previous farmdoc daily articles (February 2, 2012; February 26, 2015). The purpose of this article is to examine the sensitivity of trend projections for the 2020 U.S. average corn yield to the starting year of the estimation period.
Analysis
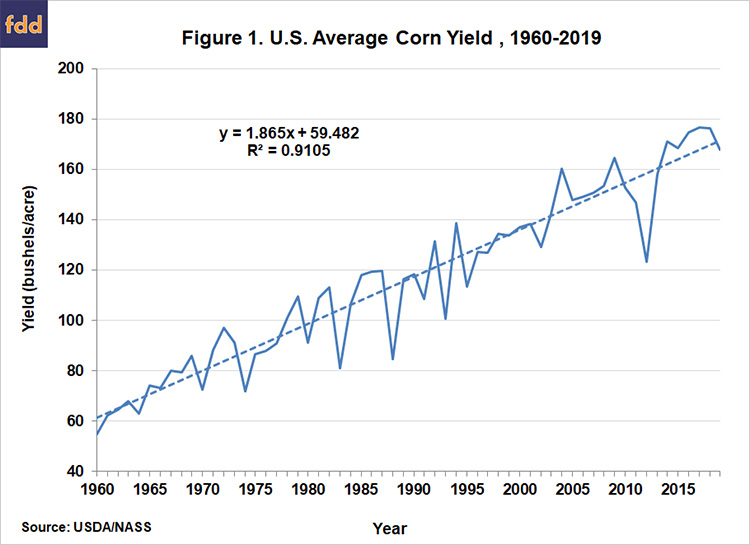
As shown in Figure 1, U.S. average corn yields have trended higher since 1960, which we consider to be the starting year of the modern period of corn production. A linear trend fit to actual average yields over that period explains 91 percent of the variation in annual average yields, and indicates that yields have increased at a rate of 1.9 bushels per acre per year. An alternative sometimes considered is the log-linear trend model (take the natural logarithm of yield before regressing on a time index), but this model also implies that the range of trend yield deviations in bushels should expand across time which clearly does not happen. It should also be noted that an important property of the linear trend model is that the percentage change in trend yields declines over time as the same bushel increase in trend yield is divided by a larger and larger base. This is consistent with the history of U.S. average corn yields since 1960.
The next step of the analysis is to project corn trend yields for 2020 by varying the starting year of the trend estimation. The procedure we follow is: i) estimate a linear trend model for 1960-2019 and project the trend yield for 2020 based on the regression estimates (this is the model shown in Figure 1); ii) estimate a linear trend model for 1961-2019 and project the trend yield for 2020 based on the regression estimates; and iii) continue this procedure moving the starting year forward one year at a time through 2000. The shortest sample period we consider is 2000-2019 in order to assure that all sample periods have at least 20 observations. This procedure generates 41 separate estimates of the trend for the U.S. average corn yield in 2020.
Figure 2 shows the projections of 2020 corn trend yields by different starting years for the sample estimation period. Sample periods starting in the 1960s consistently generate 2020 trend estimates near 173 bushels per acre. Moving the starting year into the 1970s and 1980s results in steadily higher trend yield estimates, peaking at 176.9 bushels per acre in 1988. There is a notable decline in 2020 trend yield estimates for samples beginning in the 1990s. The 2020 trend yield estimate based on the shortest sample, 2000-2019, is 174.6 bushels. Overall, there is a surprising sensitivity of trend yield estimates to the selected sample starting year. The range of about 4 bushels per acre in the estimates represents a swing of approximately 360 million bushels in corn production estimates for 2020. This computation assumes 89.6 million harvested corn acres provided in the May WASDE report.

The reason linear trend yield projections peak for samples starting in the 1980s is not a mystery. Figure 1 shows that two years in the 1980s had severe droughts, 1983 and 1988. If the sample estimation period began in or near these years, the fitted linear trend regression produces higher slope due to the influence of the extremely low yields in or near the start of the sample. As an example, imagine drawing a line connecting the yield in 1988 with 2019 versus 1987 with 2019. The slope of the 1988-2019 line is much steeper.
Another finding is that trend yield estimates decline after peaking in the 1980s. There has been considerable discussion for the last 20 years about the rate of increase in corn trend yields. A variety of factors related to yield trend continue to show up in the discussion. A changing climate leading to improved growing conditions, improved genetics, and management are a few of the factors discussed (e.g., Tannura, Irwin, and Good, 2008). If this was the case, we would expect to find further increases in projected 2020 trend yields for more recent sample periods. But we do not. This is certainly not the last word on the subject as trend yield increases may be difficult to identify with the simple linear regression methods used here. Furthermore, it is possible that any trend changes are quite recent, say in the last 5 to 10 years, which would be difficult to detect with a limited amount of data.
A final issue is raised by the fact that the 2020 trend yield estimates presented in Figure 2 are “unconditional.” This methodology actually results in a slight under-estimate of trend yield due to the asymmetric effect of weather on actual yields (e.g., Swanson and Nyankori, 1979). That is, poor weather reduces yields more than good weather improves yields so that the impact of technology (trend) is under-estimated due to sharp reductions in yield from poor weather years, such as 1974, 1983, 1988, 1993, and 2012 (for those with a statistical bent this is more formally known as an omitted variables bias). The level of bias was estimated to be about 2 bushels per acre in a previous farmdoc daily article (February 26, 2015), but this is only a rough guide and not the result of any detailed analysis.
Implications
Trend yield and harvested acreage projections are foundations for early season forecasts of U.S. corn production. We find that linear trend yield projections for corn in 2020 can vary by as much as 4 bushels per acre simply based on the starting year used for the estimation period. This represents a swing of about 360 million bushels in the projection of U.S. corn production for 2020, by no means a trivial amount. The lowest trend yield projections are based on samples starting in the 1960s and the highest for samples starting in the 1980s. There is no easy way to decide which sample is the most accurate for projecting trend yields in 2020. We lean to either longer or shorter sample periods in order to minimize the impact of years with extremely low yields in the 1980s. In future farmdoc daily articles, we will repeat this exercise using a crop weather model developed by the USDA and used to guide WASDE yield projections in May through July. This allows us to directly estimate any bias inherent in unconditional trend regression models.
References
Irwin, S. and D. Good. “Forming Expectations for the 2015 U.S. Average Corn Yield: What Does History Teach Us?“ farmdoc daily (5):36, Department of Agricultural and Consumer Economics, University of Illinois at Urbana-Champaign, February 26, 2015.
Irwin, S., and D. Good. “The Historic Pattern of U.S Corn Yields, Any Implications for 2012?” farmdoc daily (2):21, Department of Agricultural and Consumer Economics, University of Illinois at Urbana-Champaign, February 2, 2012.
Swanson, E.R., and J.C. Nyankori. “Influence of Weather and Technology on Corn and Soybean Yield Trends.” Agricultural Meteorology 20(1979):327-342.
Tannura, M., S. Irwin, and D. Good. “Are Corn Trend Yields Increasing at a Faster Rate?” Marketing and Outlook Brief 2008-02, Department of Agricultural and Consumer Economics, University of Illinois at Urbana-Champaign, February 2008.