Late Planting and Projections of the 2019 U.S. Soybean Yield
In a May 1, 2019 farmdoc daily article, we examined the implications of late planting of the U.S. corn crop on yield expectations for 2019. Planting date considerations for soybeans are also important but do not seem to attract as much attention as in the case of corn. The USDA’s weekly Crop Progress report indicated that only 39 percent of the soybean acreage in 18 major producing states was planted as of June 2, compared to 86 percent last year and a five-year average of 79 percent. Similar to corn, planting across the entire Corn Belt has been delayed compared to last year due to very wet conditions. In particular, soybean planting in the eastern Corn Belt lags very significantly. The purpose of this article is to quantify the lateness of soybean planting in 2019 and estimate the impact of the lateness on projections of the U.S. average soybean yield.
Analysis
We begin the analysis by considering the beginning date for a significant late planting penalty for soybean yields. There is not complete agreement on the optimum planting window for maximizing soybean yields or the date when late planting begins to impose a substantial yield penalty. Both the optimum window and cutoff date for a significant late planting penalty certainly varies by geographic location. For market analysis purposes, however, it is useful to identify one date for the end of the optimum window that can be applied to the U.S. soybean crop. Acreage planted after that date would be considered to be planted late and yield potential would be expected to be reduced as the percentage of the acreage planted late increases.
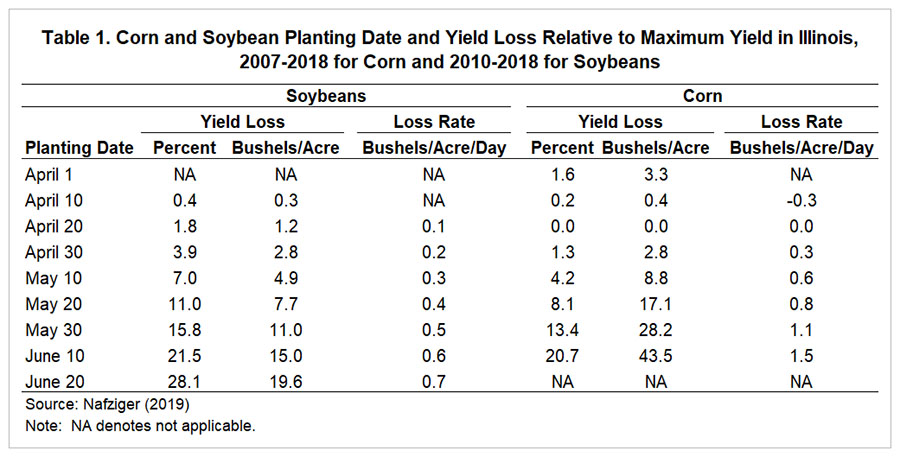
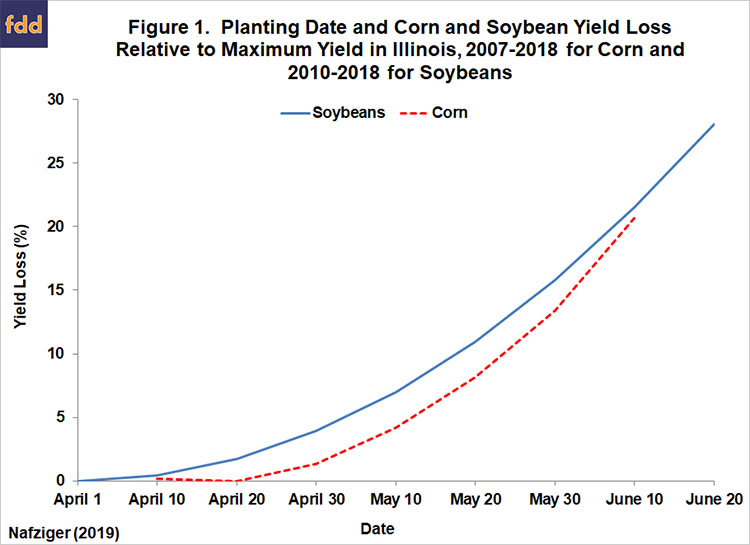
In order to set the late planting cutoff date, as we have in the past (farmdoc daily, May 2, 2018), we review information generated from agronomic research relating planting date to soybean yields at the farm-level. We begin with information generated from agronomic research relating planting date to soybean yields. The data for the yield response curve is based on an average of central and northern Illinois sites over 2010 through 2018. Professor Emerson Nafziger kindly provided the data in the form of a yield penalty by planting date shown in Table 1. For comparison, we also present the yield penalty by planting date for corn from our recent farmdoc daily article (May 1, 2019). It is striking how similar the optimal planting windows in Illinois are for corn and soybeans. In both cases, yield loss is minimized by planting in mid- to late April. The yield penalties become increasingly large as planting is delayed after mid-May. For example, planting on or after May 30 results in a soybean yield loss of 15.8 percent, or 11 bushels per acre. The yield loss functions for corn and soybeans are plotted side-by-side in Figure 1, and this suggests that if not planted earlier, soybeans should be planted around the same time as corn in Illinois.
Results from soybean planting date research for different years and different locations vary throughout the U.S., but the evidence indicates planting on or before May 1 generally is associated with higher yield. De Bruin and Pederson (2008) provide widely-cited evidence in this regard for Iowa and also highlight earlier studies from the 1980s and 1990s that showed the benefits of earlier planting of soybeans in the upper Midwest of the U.S. Early planting benefits are not limited to the Midwest. A veritable revolution has occurred in the Mid-South and Delta regions in the last 25 years regarding soybean planting dates. For example, Orlowski and Irby (2017) show that the optimum window for planting irrigated soybeans in Mississippi is centered on late April to early May. In all cases for the Midwest and the South, yield penalties rise rapidly for planting dates after mid- to late May.
We have previously defined the beginning date for substantial late planting penalties on soybean yield in the U.S. to be June 5 from 1980-1985, May 30 from 1986-1999 and May 25 from 2000 forward (farmdoc daily, May 2, 2018). One can certainly argue for an earlier cutoff date in later years, e.g., May 10, in the heart of the Corn Belt based on the data in Table 1 and other similar studies. However, we opt for the May 25 date in light of the large shift in soybean acreage in the far northern parts of the Corn Belt and the later date of the optimal planting windows in these areas. This also keeps the cutoff date for soybean late planting after the cutoff date for corn (May 20), consistent with the behavior of U.S. farmers in planting the two crops.
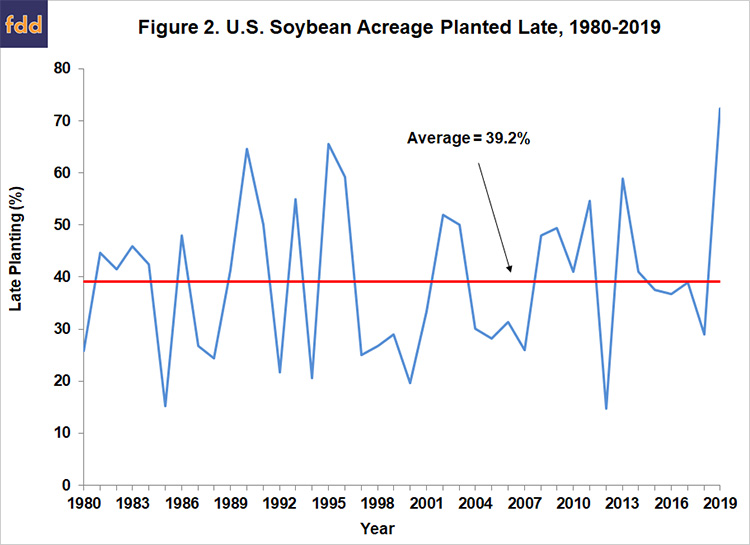
Figure 2 shows the percentage of soybeans planted late in the U.S. over 1980-2019 based on the cutoff dates specified above. On average, late planting based on this measure was 39 percent (rounded), with the bulk of the observations between about 20 and 50 percent. There is no evidence of a trend up or down over time in the late planting percentage using our cutoff dates, which results in a stable measure of late planting. The average level of late planting for soybeans, 39 percent, is much higher than for corn, 16.8 percent, which was reported in the farmdoc daily article of May 1, 2019. At least half of this difference can be attributed to double-crop planting of soybeans. Late-planted soybean acreage in 2019 came in at the highest total since 1980 with 72 percent remaining to be planted as of March 30. While 2019 was the highest in the sample period, note that late planting was almost as high in two previous years (1990 and 1995).
The next step of the analysis is to estimate the impact of late planting on the U.S. average soybean yield. Figure 3 shows the relationship between the trend deviation for U.S. soybean yield and the deviation from average for U.S. soybean acreage planted late over 1980 through 2018. A quadratic trend is used to compute the trend yield deviations. As expected, there is an overall negative relationship between late planting and soybean yield deviations from trend. Unlike the highly non-linear relationship seen in corn yield deviations under high late-planted acreage (farmdoc daily, May 1, 2019), the relationship is linear with respect to soybean yield and late-planted acreage. The regression model indicates that for each 1 percent increase in late planting the national average soybean yield drops by only about 0.05 bushels per acre. This is almost exactly the same as the estimate we presented last year using a fully-specified crop weather regression model. This is important because it indicates the coefficient estimate is not downward biased due to the omission of important weather variables that affect soybean yield.
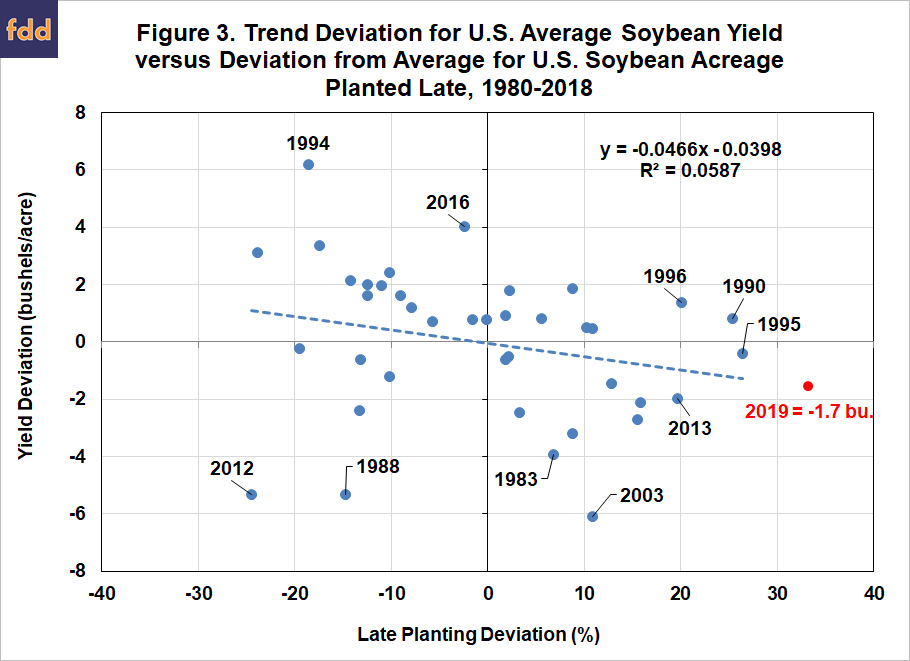
It should also be emphasized that the explanatory power of the regression model in Figure 3 is quite low, as the R2 is only 5.9 percent. This does not mean that late planting should be ignored when projecting soybean yield, but rather, other factors, in particular summer weather, are typically more important in explaining deviations from trend yield. Two years provide good examples. Late planting was well above average in 2013 but the soybean yield came in at a record at the time of 44 bushels per acre due to a cool, wet summer despite being below trend. Conversely, late planting in 2012 was at the low end of the sample range but soybean yield was extremely low relative to trend due to the severe drought that summer.
Using the regression model in Figure 3 and this year’s late-planted acreage level for soybeans, a yield loss of only 1.7 bushels per acre is projected for 2019. For example, if one starts with a trend projection of 49.5 bushels per acre, the projected soybean yield would still be at a historically high level of 47.8 bushels. The projection of yield loss implied by the data in Figure 3 differs substantially from that implied by field trial studies. The planting date response results in Table 1 imply that the 61 percent of the soybean crop planted after June 2 this year should have expected yield losses of about 10-15 bushels per acre. The bottom-line is that very different conclusions can be reached about expected yield declines for soybeans this year depending on whether one relies more heavily on planting date field trial results or the relationship implied by aggregate planting date and yield data.
The puzzling difference between planting date filed trial results and those based on aggregate data is further highlighted by close inspection of the results in Figure 3. Specifically, most U.S. average yield deviations from trend fall between -3 and +3 bushels per acre since 1980. When one considers late-planted acreage greater than 20 percent above average, only five observations occurred since 1980. The years were 1990, 1995, 1996, 2013, and 2019. Only 2013 recorded a substantial yield deviation more than -2 bushels per acre. While it is reasonable to use field trial data on yield expectations for soybeans this year, actual U.S. soybean yield observations under late planting conditions do not provide support to these severe yield penalties under late-planting. While the potential for above trend yields is greatly reduced under current conditions, the possibility for dramatic yield losses appears less likely than corn yields when considering aggregate data on soybean yield deviations from trend.
Implications
The impact of late planting on projections of the U.S. average soybean yield is an important question right now due to the very wet conditions so far this spring through much of the Corn Belt. We estimate that the relationship of late planting with soybean yield trend deviations is linear, with a limited possibility of severe yield penalties under late-planting. Specifically, our model using U.S. average yields and a measure of late planting imply a yield loss of only 1.7 bushels per acre for 2019. The key then for 2019 is whether late soybean planting will be associated with the large yield losses present in field trial data or conform to historical observations with much smaller yield losses. The implication is that there is an elevated probability of a below-trend soybean yield in 2019, but the yield loss may not meet the dramatic levels seen in field trial data. It is important to recognize that good summer weather conditions can offset the projected negative impact of late planting on the national average soybean yield.
References
De Bruin, J. L., and P. Pedersen. “Soybean Seed Yield Response to Planting Date and Seeding Rate in the Upper Midwest.” Agronomy Journal 100(2008):696-703.
Irwin, S. and T. Hubbs. “Late Planting and Projections of the 2019 U.S. Corn Yield.” farmdoc daily (9):79, Department of Agricultural and Consumer Economics, University of Illinois at Urbana-Champaign, May 1, 2019.
Irwin, S. and T. Hubbs. “Prospects for Timely Planting of the 2018 Soybean Crop.” farmdoc daily (8):79, Department of Agricultural and Consumer Economics, University of Illinois at Urbana-Champaign, May 2, 2018.
Nafziger, E. “Personal Email Communication.” 2019.
Orlowski, J. and T. Irby. “Soybean Planting Dates and Maturity Groups for Mississippi.” Mississippi Crop Situation, March 29, 2017. http://www.mississippi-crops.com/wp-content/uploads/2017/03/Figure-2-Stoneville-with-simulated.jpg
USDA, National Agricultural Statistics Service. Crop Progress (release weekly). http://usda.mannlib.cornell.edu/MannUsda/viewDocumentInfo.do?documentID=1048
Source: Scott Irwin and Todd Hubbs, Farmdocdaily