Late Planting Decisions in 2019
 Planting over much of the Midwest is seriously delayed. History suggests the odds have also increased for lower corn yields in 2019 than in 2018 (farmdoc daily, May 1, 2019), and soybean yields likely will not be exceptional. Lower yields then potentially lead to very low net incomes. The typical switching from corn to soybean decisions are complicated because of low soybean prices. Prevented planting could come into play on many farms.
Late Planting 2019
Very little planting has occurred over much of the Corn Belt. According to the May 6th Crop Progress report, 23% of the acres were planted in the 18 largest corn-producing states, compared to a 46% average for the last five years. Low percentages exist in all greater Corn Belt states:
- North Dakota: 3% in 2018 compared to a 23% five-year average,
- South Dakota: 0% compared to 29% five-year average,
- Nebraska: 35% compared to a 47% five-year average,
- Kansas: 36% compared to a 51% five-year average,
- Minnesota: 6% compared to a 42% five-year average,
- Iowa: 36% compared to a 51% five-year average,
- Missouri: 49% compared to a 74% five-year average,
- Wisconsin: 7% compared to a 24% five-year average,
- Illinois: 10% compared to a 66% five-year average,
- Indiana: 3% compared to a 35% five-year average,
- Michigan: 3% compared to a 16% five-year average, and
- Ohio: 2% compared to a 27% five-year average.
Rains are projected for this week, likely further limiting planting progress.
Likelihood of Lower Yields
Perhaps the largest impact of late planting will be on 2019 yields. In the past six years, yields have been exceptional across Illinois in particular and the Midwest generally (see farmdoc daily, September 5, 2018). The higher 2018 yields kept net incomes high enough such that serious declines in liquidity did not occur on many farms. Very low incomes would result if yields are near trend, and there is not an increase in prices or another round of Market Facilitation Program (MFP) payments (farmdoc daily, January 15, 2019). Commodity program payments, either through Price Loss Coverage (PLC) or Agricultural Risk Coverage (ARC), likely will be important sources of revenue, particularly on soybeans.
Late planting does not necessarily mean that 2019 yields will be low. In 2009, much late planting of corn occurred and national yields were still 10 bushels above trend (farmdoc daily, May 1, 2019). Despite exceptions, higher percentages of late planting of corn typically lead to below trend yields (farmdoc daily, May 1, 2019). A good illustration of the impacts of late planting of corn due to wet weather occurred last year in northern Iowa and southern Minnesota. County yields near the Iowa-Minnesota border were below trend in 2018, both for corn and soybeans (see farmdoc daily, April 9, 2019).
Corn and Soybean Prices
As of yet, there has been no positive price response to late planting and, in fact, corn and soybean have declined in recent months. To illustrate, current Chicago Mercantile Exchange (CME) futures prices are below projected prices used to set crop insurance guarantees. For corn and soybeans in Midwest states, projected insurance prices are the average settlement prices of Chicago Mercantile Exchange (CME) contracts during the month of February. The December contract is used for corn and the November contract is used for soybeans. The 2019 projected corn price is $4.00 per bushel, while the May 6th settlement price is 4.5% lower at $3.82 per bushel. The 2019 projected price of soybeans is $9.54, while the May 6th settlement price is 11% lower at $8.50 per bushel. Soybean prices have declined more than corn. Current cash bids for fall delivery are near $8.00 for soybeans in central Illinois. Sub-$8.00 soybean prices are a real possibility come this fall.
While neither corn nor soybean prices are particularly attractive, soybeans prices appear to have more downside potential (farmdoc daily, May 6, 2019). The prospects of eliminating Chinese tariffs on U.S. soybeans appear to be diminishing. Even if tariffs are resolved, the presence of African Swine Fever (ASF) in China could reduce soybean demand. Both corn and soybean production in South America are higher in 2019 than in 2018 (WASDE, April 2019). The strengthening of the U.S. dollar relative to the Brazilian Real and Argentinian Peso further favors South America exports over U.S. exports. Furthermore, soybean prices could further decline if U.S. producers switch significant acres from corn to soybeans due to late planting conditions.
Corn versus Soybean Decisions
Weakening soybean prices complicates late planting decisions, making the typical switching decisions from corn to soybean more difficult. Table 1 shows break-even soybean yields for a $3.50 corn price and an $8.00 soybean price, the current bids for fall delivery in central Illinois. Break-even soybean yields are given for northern Illinois, central Illinois with high-productivity farmland (Central-High), central Illinois with low-productivity farmland (Central-Low), and southern Illinois. Although costs vary across these regions, break-even soybean levels do not vary much across the regions. At a 190 bushels corn yield, for example, the break-even soybean yields are 52 bushels per acre in the Central-low region and 55 bushels per acre in the other regions.
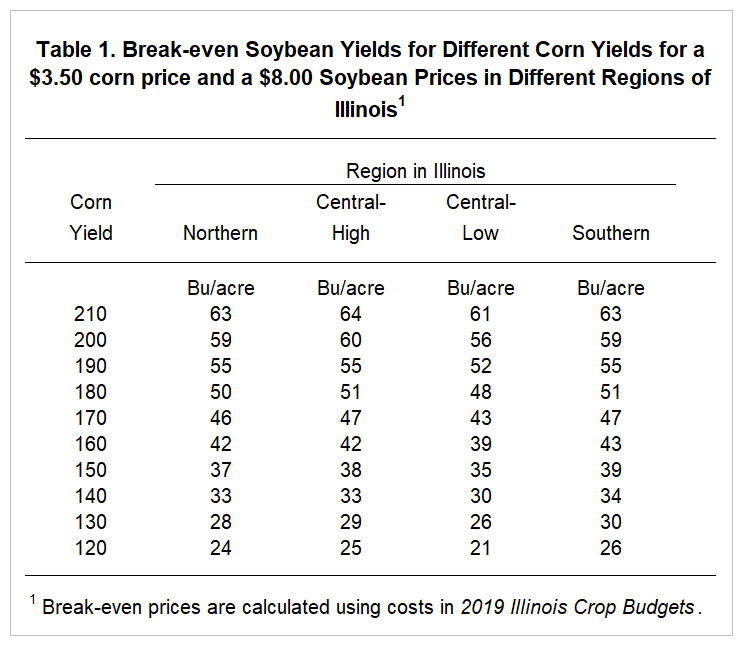
A further complication is the possibility of another Market Facilitation Program (MFP) payments. In 2018, the MFP resulted from the Trump Administration’s desire to compensate farmers for losses due to trade disputes. Payments were $1.65 per bushel for soybeans and $.01 per bushel for corn on 2018 production. A 2019 MFP payment levels could be different than in 2018. Adding $1.65 to the $8.00 soybean price would lower break-even soybean yields between 6 and 10 bushels per acre for expected corn yields above 150 bushels per acre. The Trump administration has indicated that MFP payments will not occur in 2019.
Prevented Planting Payments on Corn
Prevented planting payments are available from the COMBO crop insurance policy once the “final planting date” has been reached. The COMBO policy includes Revenue Protection (RP), Revenue Protection with the harvest price exclusion, and Yield Protection. Prevented planting payments do not exist for the Area Risk Protection Insurance policy.
Prevented planting payments will become an option once “final planting dates” are reached. Before the final planting date, farmers are to make all efforts to plant corn on intended acres. Final planting dates for grain corn varies across Midwestern states (see Figure 1). May 31 is the “final planting date” for Iowa, southern Minnesota and Wisconsin, northeastern Missouri, the extreme southern counties of Illinois, and Kentucky. June 5 is the date for most of Illinois, Indiana, Ohio, and Michigan.

Once the final planting date has been reached, a prevented planting payment for corn can be taken if corn is not planted for insurable causes (e.g., wet weather). Unless a 5% buy-up has been purchased, the prevented planting payment will be 55% of the guarantee. Take a unit with a 200 bushels per acre Trend Adjusted — Actual Production History (TA-APH) yield, this year’s projected price of $4.00 per bushel, and an 80% coverage level. In this case, the prevented planting payment will be $314 per acre (200 TA-APH yield x $4.00 projected price x 80% coverage level x .55 prevented payment factor). In certain cases, taking the prevented planting payment make look like an attractive alternative.
Prevented Planting for Soybeans
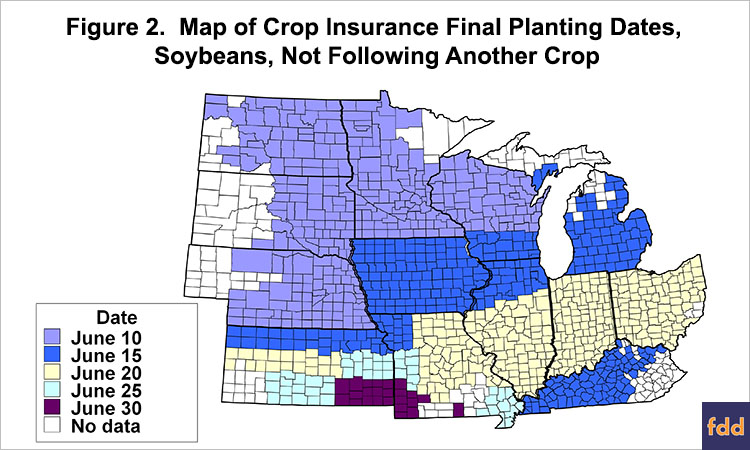
Final planting dates for soybeans are different than for corn (see Figure 2). June 15 is the final planting date for Iowa, northern Illinois, Michigan, and Kentucky. June 20 is the final planting date for the southern two-thirds of Illinois, as well as Indiana and Ohio.
The prevented planting payment for soybeans is 60%, not 55%, of the guarantee. Take a situation where the Trend Adjusted — APH yield is 55 bushels per acre. The soybean projected price is $9.54. If the individual took an 80% coverage level, the prevented planting payment will be $254 per acre (55 TA-APH yield x $9.54 projected price x 80% coverage level x .60 prevented payment factor)
Acres Eligible for Prevented Planting
Even though prevented planting decisions are not imminent for the Midwest, it is useful to understand how acres eligible for prevented planting are determined. Acres eligible for prevented planting is limited to the number of acres in the insurable unit unless there is a history of double-crop production on that unit. If the acres in the unit have not increased, the number of acres eligible for a crop equals the maximum acres planted to that crop in the insurable unit over the last four years. Take an insurable unit with 100 acres in this year and each of the last four years. If the maximum number of acres planted to corn in the last four years is 60 acres, the number of acres eligible for corn prevented planting is 60 acres. A similar calculation would be done for soybeans. If the acres in the unit have increased, each crop’s prevented planting acres will increase proportionately. Other planting requirements in previous years exist.
Because determining acres eligible for prevented planting is complex, discussing it with a crop insurance agent is recommended.
Summary
Three implications exist because of late planting. First, incomes could be very low because exceptional yields are less likely. Earlier in the year, projections suggested that net incomes on Illinois farms would be negative if yields were at trend, commodity prices did not rise, and a new round of MFP payments did not occur (farmdoc daily, January 15, 2019). Soybean prices are lower now than those used in income projections. Without exceptional yields, higher prices or a new round of MFP payments will be needed to have positive incomes.
Second, switching decisions to soybeans will be complicated this year because of low soybean prices. Downward pressures on soybeans could increase even more if acres switch from corn to soybeans.
Third, prevented planting could come into play on many farms. Obtaining the number of acres eligible for prevented planting by crop for each insurance unit is useful background information to acquire at this time of low planting activity in case planting decisions need to be made after the prevented planting date.
References
Hubbs, T. “Soybean Acreage and Exports.” farmdoc daily (9):82, Department of Agricultural and Consumer Economics, University of Illinois at Urbana-Champaign, May 6, 2019.
Irwin, S. and T. Hubbs. “Late Planting and Projections of the 2019 U.S. Corn Yield.” farmdoc daily (9):79, Department of Agricultural and Consumer Economics, University of Illinois at Urbana-Champaign, May 1, 2019.
Schnitkey, G. “2018 County Corn and Soybean Yields: Exceptional Yields in Central Illinois and the Eastern United States.” farmdoc daily (9):63, Department of Agricultural and Consumer Economics, University of Illinois at Urbana-Champaign, April 9, 2019.
Schnitkey, G. “Grain Farm Income Outlook for 2019: Negative Incomes Ahead?.” farmdoc daily (9):7, Department of Agricultural and Consumer Economics, University of Illinois at Urbana-Champaign, January 15, 2019.
Schnitkey, G. “Exceptional 2018 Corn and Soybean Yields and Budgeting for 2019.” farmdoc daily (8):165, Department of Agricultural and Consumer Economics, University of Illinois at Urbana-Champaign, September 5, 2018.
USDA, National Agricultural Statistics Service. Corn Progress (May 2019), released and accessed on May 6, 2019. https://downloads.usda.library.cornell.edu/usda-esmis/files/8336h188j/h128np99z/gt54kx142/prog1919.pdf
USDA, Office of the Chief Economist. World Agricultural Supply and Demand Estimates. WASDE-587-2, released April 9, 2019, and accessed May 7, 2019. https://www.usda.gov/oce/commodity/wasde/wasde0419.pdf
Source: Gary Schnitkey and Carl Zulauf, Farmdocdaily