MFP and CFAP Payments, Corn and Soybean Uses, and Future Farm Profitability
 Federal aid in the form of Market Facilitation Program (MFP) and Coronavirus Food Assistance Program (CFAP) payments have increased returns and the financial stability of grain farms in 2018, 2019, and likely in 2020. However, corn and soybean returns have been low since 2013, when the growth of corn use in ethanol plateaued. Recent declines in soybean exports have made worsened returns. The uses of corn and soybeans must grow in the future if corn and soybean returns are to reach higher levels. If uses do not increase, a combination of two items will need to occur: 1) financial aid and intervention from the Federal government will need to continue, or 2) farmers will need to make financial adjustments as well as lower cash rents. These factors are illustrated by evaluating time trends of corn and soybean returns and then associating return periods with corn and soybean use.
Projecting 2020 and 2021 Returns
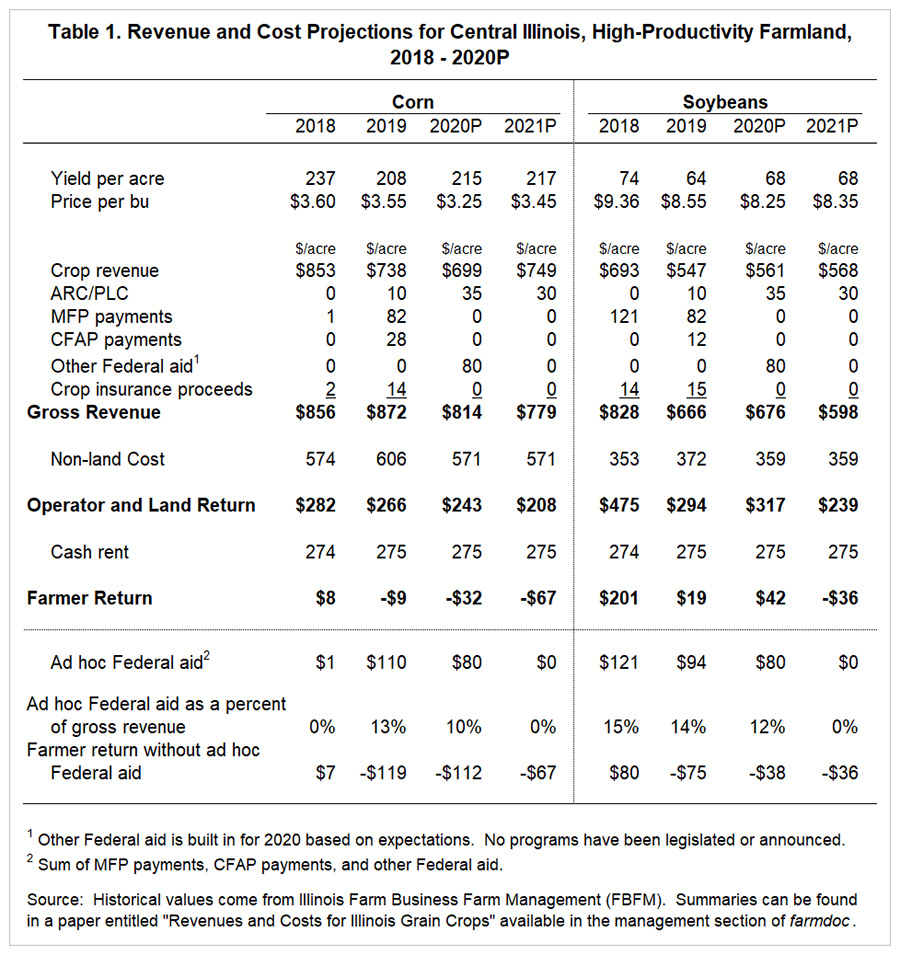
Revenue and costs for 2020 and 2021 are projected for corn and soybean production in central Illinois on high-productivity farmland. These projections then are compared to historical values from farms enrolled in Illinois Farm Business Farm Management (FBFM). Historical values are taken from a publication entitled Revenue and Costs for Illinois Grain Crops, available in the management section of farmdoc (click here). Table 1 shows a detailed breakdown of revenues for the years from 2018 to 2021. Results come from FBFM for 2018 and 2019. Budgets for 2020 and 2021 are projections. Corn and soybean price projections are explained in detail provided in a farmdoc daily published on April 28, 2020. The MYA projected prices for 2019 through 2021 are adjusted from the base MYA projections in the April 28th publication by $.05 per bushel to account for typically higher prices that occur in central Illinois.
Corn Returns
Corn in 2019: For 2019, crop revenue for corn is projected at $738 per acre based on a 208 bushel per acre yield and a $3.55 per bushel price. The $3.55 price has come down significantly from a $3.90 price used before the COVID-19 outbreak, a $.35 per bushel price decline. The $.35 decline reduces crop revenue by $73 per acre.
Other revenue for corn in 2019 includes:
- ARC/PLC payments of $10 per acre. Commodity title payments are paid on base acres, not planted acres. As a result, commodity title payments for 2019, 2020, and 2021 are the same for both corn and soybeans. Projections per base acre are made, and the average is applied to each corp. The $10 payment for 2019 is an acre-weighted average over both corn and soybean base acres.
- Market Facilitation Program (MFP) payments of $82 per acre. In 2019, these payments were on a per acre basis and averaged $82 per acre in central Illinois (see farmdoc daily, July 30, 2019).
- Coronavirus Food Assistance Program (CFAP) payments of $28 per acre. For corn, the CFAP payment is $.335 per bushel times the lower of 50% of 2019 production or eligible inventory on January 15, 2020 (see farmdoc Daily, May 22, 2020 and May 28, 2020). The $28 payment is based on 40% of 2019 production being eligible for CFAP payments.
- Crop insurance proceeds of $14 per acre.
Summing individual revenue components results in gross revenue for corn of $872 per acre. Non-land costs in 2019 were $606 per acre, resulting in operator and land return of $266 per acre. Operator and land return shows the amount remaining to the farmer before paying land costs, which will vary whether farmland is owned, share rented, or cash rented. Table 1 shows farmer return given cash rents at the average level for central Illinois. After deducting the $275 per acre average cash rent for 2019, the farmer return is -$9 per acre.
Corn in 2020: For 2020, corn revenue is projected at $699 per acre, based on a 215 bushel per acre yield and a $3.25 per bushel price. The 215 bushel yield is a trend yield, which will be updated after July weather provides better indications of yields. Higher yields may be expected given a typical year with good rains in July. However, higher yields could also lower prices, leaving total gross revenue and returns largely unchanged. A higher yield likely would also lead to more corn supply and carry over into the 2021 marketing year, causing lower expected prices in 2021.
Other revenues in 2020 include a ARC/PLC payment of $35 per acre. This payment is composed of a large payment on corn base acres enrolled in PLC and little to no payments on base acres in soybeans or ARC-IC. The average across corn and soybean acres of $35 per acre is then applied to both corn and soybeans in 2020.
Also included for corn in 2020 is an $80 payment in other Federal aid. Although there have not been any relief programs for 2020 legislated or announced by the U.S. Department of Agriculture, a payment is included with the assumption that some form of continued Federal aid to offset impacts of COVID-19 control measures will be forthcoming.
Given those sources of revenue, gross revenue is projected at $814 per acre. Subtracting $571 of non-land costs leaves an operator and land return of $243 per acre. Farmer return for corn in 2020 is -$32 per acre, a significant loss even with $80 per acre of additional aid.
Corn in 2021: For 2021, projections are for crop revenue of $738 per acre and an ARC/PLC payment of $30 per acre. No other Federal aid is included. Election results and other events suggest a clouded outlook for continued Federal aid. Non-land costs and cash rents for 2021 are projected to remain at their 2020 level, leaving a -$78 return projected for 2021.
Note that there is a downward trend in farmer returns for corn over the years from 2018 through 2021. Farmer returns were $8 per acre in 2018, -$9 in 2019, -$32 in 2020, and -$78 in 2021. Further note that the -$32 return in 2020 includes $80 of “other Federal aid” which is only an assumption at this point. Without this aid, which has not been announced or legislated, farmer return in 2020 would be projected at -$112 per acre
Soybean Returns
Soybeans in 2018: In 2018, farmer returns for soybeans were $201 per acre, which includes $121 per acre in MFP payments. For 2018, MFP payments were paid on production with effective payments rates of $.005 per bushel for corn and $.825 per bushel for soybeans (farmdoc daily, August 29, 2018). The $121 accounted for over half of the $201 per acre farmer return in 2018.
Soybeans in 2019: For 2019, crop revenue for soybeans was $547 per acre based on a 64 bushel per acre yield and an $8.55 per bushel price. Soybean crop revenue in 2019 includes $10 per acre for ARC/PLC and $82 per acre for MFP payments, the same as for corn.
Soybeans in 2020: In 2020, crop revenue is projected at $561 per acre based on a 68 bushel per acre yield and an $8.25 price. The yield of 68 bushels per acre is a trend yield, which likely will change as the growing season progresses. Most likely, higher 2020 yields would be associated with lower 2020 prices, leading to muted gross revenue increases. As with corn, higher soybean yields likely lead to more soybean supplies and lower prices for 2021.
Soybeans in 2021: For 2021, a trend yield of 68 bushels per acre is used and the projected soybean price of $8.35 per bushel, giving crop revenue of $568 per acre. With a $30 per acre ARC/PLC payment, gross revenue in 2021 is projected at $598 per acre. Given the same non-land costs ($359 per acre) and cash rent ($275 per acre) as in 2020, farmer return is projected at -$36 per acre in 2021.
MFP and CFAP Payments
The bottom part of Table 1 lists the sum of farmer aid from CFAP and MFP programs, with likely other Federal aid of $80 per acre associated with the 2020 crop. This “ad hoc Federal aid” is outside the legislated farm safety net, and was instituted to compensate farmers for trade difficulties (MFPs) and COVD-19 control measures (CFAP).
For the 2018 through 2020 crops (with an assumed program for 2020), this aid has contributed significantly to gross revenue. For soybeans, ad hoc Federal aid constitutes 15% of revenue in 2018, 14% in 2019, and a projected 11% in 2020. Without additional Federal aid, farmer returns for both corn and soybeans would have been negative in 2019 and 2020. Without additional aid in 2021, corn and soybean returns are projected negative.
Undoubtedly, these additional Federal aid programs have been important in maintaining the financial stability of many grain farms. It also could have postponed making necessary adjustments that otherwise would have occurred in a low-price environment. For example, cash rents have not declined much even in the face of lower prices since 2013, and particularly since 2018 (for trends in cash rents, see farmdoc daily, September 27, 2019).
Recent Corn and Soybean Returns in Historical Perspective
Farmer returns from 2018 through 2020 in Table 1 are placed in a longer context in Figure 1, which shows farmer returns from 2000 through the 2021 projections. Several items to note. First, farmer returns were higher in the years from 2006 thought 2013 and have been much lower since 2013. Farmer returns for corn averaged $217 per acre from 2006 to 2013, and -$30 per acre from 2014 to 2018. For soybeans, farmer returns averaged $150 per acre from 2006 to 2013, and $64 per acre from 2014 to 2018.

Also, evident from Figure 2 is a switch in crop profitability in the years before and after 2012. From 2000 to 2012, corn was more profitable than soybeans in eleven out of thirteen years. From 2000 to 2012, farmer returns averaged $148 per acre for corn and $95 per acre for soybeans. Since 2013, soybeans have been more profitable than corn, albeit at much lower levels. From 2014 to 2018, farmer returns averaged -$30 per acre for corn and $64 per acre for soybeans.

Changing Use Impacts Corn and Soybean Returns
There are two distinct patterns shown by the farmer returns in Figure 1:
- Higher returns in the period from 2006 through 2012, followed by a period of much lower returns following 2013.
- A switch in crop profitability in 2013, with soybeans more profitable than corn after 2013.
These patterns are highly related to changes in corn and soybean use over time. Figure 2 breaks corn use into three major groups that account for how almost all U.S. corn is used: 1) Feed and Residual, 2) Food, Alcohol, and Industrial (FAI) use, and 3) Exports. Ethanol is categorized as FAI, and ethanol use grew dramatically between 2002 and 2013. FAI uses grew from 2,335 million bushels in 2003 to 6,566 million bushels in 2013, an increase of 4,166 million bushels, or 78%. This large growth caused commodity price increases and higher corn and soybean returns. The growth in ethanol slowed dramatically in 2013, leading to a slowing in the growth of overall corn use. In the marketing year for 2019 (September 2019 through August 2020), ethanol use is projected to decline, largely due to reductions in fuel use due to COVID-19 control measures (See Figure 2).
Soybean use in the U.S. continued to grow steadily over time, with growth in exports progressing at a faster pace than domestic crush and even exceeding crush from 2015 to 2017 (see Figure 3). This growth was largely driven by increased exports to China over the past two decades. Trade difficulties with China caused dramatic declines in exports of soybeans in 2018 and 2019 (see Figure 3).

The period of high corn and soybean returns from 2006-2012 corresponds to increasing corn use in ethanol and strong growth in soybean exports. The era of large ethanol growth ended in 2013, corresponding to the fall in corn and soybean returns in 2013. From 2013 to 2017, soybean exports continued to grow while the use of corn remained more stable. Soybean returns exceeded corn returns. In 2018, trade difficulties with China caused soybean exports to decline. In 2018 and 2019, corn and soybean returns would have been significantly lower without MFP and CFAP payments.
Commentary
Without large changes in expected supply and demand conditions, additional Federal aid likely will be needed in 2020 and 2021 to avoid large losses for corn and soybean production. Whether this aid is forthcoming is a good question, particularly after the 2020 election.
Even with additional Federal aid, longer-run profitability is questionable on corn and soybean farms. Farm returns have been low since 2013 when corn use of ethanol declined. Export demand growth for soybeans continued to be a bright spot for farms rotating between the two crops until 2018. Trade disputes and COVID-19 control measures have disrupted the already stressed demand side for corn and soybeans and now brings into question future use levels for both soybeans and corn. Soybean exports may not return to pre-trade dispute levels in the near future. Similarly, corn use in ethanol may not rebound in 2020 or for several years into the future, if ever.
Consideration should be given to efforts to increase the uses of both corn and soybeans. Ethanol and biofuels policies have impacted returns in the recent past, and efforts to sustain and continue that growth would aid corn and soybean returns. Similarly, efforts to keep U.S. exports competitive with other countries likely would have longer-run benefits for farmers.
If uses do not grow, ad hoc Federal aid could continue into 2021 and beyond, but it seems unlikely that this aid will continue indefinitely. When this aid ends, farmers will need to make financial adjustments, and cash rents will need to fall if uses do not grow in the meantime. Farmers may wish to begin to prepare for this possibility, making changes in financial structure and cash rents currently.
References
Paulson, N., G. Schnitkey, J. Coppess, C. Zulauf and K. Swanson. “Coronavirus Food Assistance Program (CFAP) Rules Announced.” farmdoc daily (10):95, Department of Agricultural and Consumer Economics, University of Illinois at Urbana-Champaign, May 22, 2020.
Schnitkey, G. “2019 Illinois County and State Cash Rents.” farmdoc daily (9):181, Department of Agricultural and Consumer Economics, University of Illinois at Urbana-Champaign, September 27, 2019.
Schnitkey, G., J. Coppess, N. Paulson, K. Swanson and C. Zulauf. “Market Facilitation Program: Impacts and Initial Analysis.” farmdoc daily (8):161, Department of Agricultural and Consumer Economics, University of Illinois at Urbana-Champaign, August 28, 2018.
Schnitkey, G., K. Swanson, N. Paulson, C. Zulauf and J. Coppess. “Making CFAP Applications for Grain Farms.” farmdoc daily (10):98, Department of Agricultural and Consumer Economics, University of Illinois at Urbana-Champaign, May 28, 2020.
Schnitkey, G., K. Swanson, T. Hubbs, C. Zulauf, N. Paulson, J. Coppess “Estimates of MYA Prices for 2019 thorough 2021, Pre and Post COVID-19, Corn and Soybeans.” farmdoc daily (10):78, Department of Agricultural and Consumer Economics, University of Illinois at Urbana-Champaign, April 28, 2020.
Schnitkey, G., N. Paulson, K. Swanson, J. Coppess and C. Zulauf. “The 2019 Market Facilitation Program.” farmdoc daily (9):139, Department of Agricultural and Consumer Economics, University of Illinois at Urbana-Champaign, July 30, 2019.
Source: Gary Schnitkey, Krista Swanson, Jonathan Coppess, Nick Paulson and Carl Zulauf, Farmdocdaily