Off-Farm Income and the Farm Economy-Farm Loan Delinquencies and the Great Recession
A few weeks ago, we wrote about the demographics of off-farm income. For most producers, off-farm income is an important source of funds for satisfying all their financial obligations – including family living and debt service. This week’s post is part two and looks at off-farm income and farm loan delinquencies during the last U.S. economic downturn.
Off-Farm Income
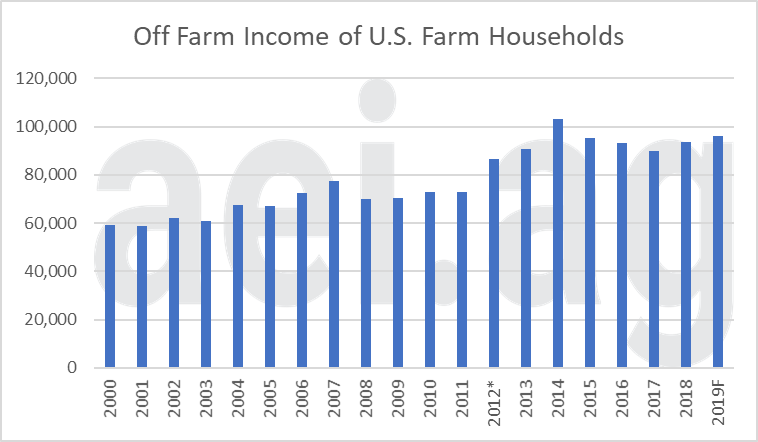
Figure 1 shows average off-farm income across all farm households. For this post, we are going to focus on 2008 and 2009, when off-farm incomes fell 10%. This decline occurred in what is now known as the Great Recession. After 2009, off-farm income would grow sluggishly through 2011. More specifically, off-farm income in 2007 was $77,400 before falling to $70,000 in 2008. By 2011 off-farm income would increase to $72,700. The 10% decline in 2008 is the largest single-year decline in 60 years of reported data.
2012 is marked with an asterisk as the USDA noted a significant change in methods. The changes included improved survey coverage and expanded off-farm income reporting that “makes comparisons between farm household statistics calculated using 2012 (and later) survey data with those from earlier surveys difficult to interpret.” In other words, be careful jumping to conclusions about trends in the data around 2012.
Since 2012, off-farm income peaked in 2014 before turning lower through 2017. Overall, off-farm income fell 13% over those four years.

Figure 1. Off-Farm Income of U.S. Farm Households, 2000- 2019F. Data Source: USDA ERS.
Farm Loan Delinquencies
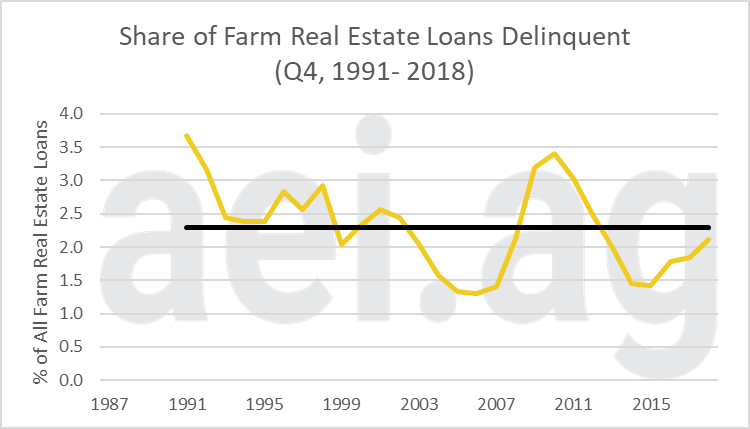
A data series we have tracked for several years is farm loan delinquencies. Figure 2 shows the share of farm real estate loans classified as delinquent (earlier post here). While conditions have trended unfavorably in recent years, current levels remain below the long-run average (2.3%) and levels observed throughout the 1990s and around 2010. For this post, the 2010 timeframe is of most interest.
Farm real estate delinquencies fell to record-lows of less than 1.5% between 2004 and 2007. By Q4 in 2010, however, farm real estate delinquencies would jump to nearly 3.5%, more than doubling in just three years. Furthermore, the delinquency rates around 2010 were at the highest levels since 1991, when the farm economy was unwinding from the Farm Financial Crisis. Of course, loan delinquencies were up across the entire U.S. economy.
After peaking in 2010, delinquencies fell as farm income soared. In 2014 and 2015, levels would, again, fall below 1.5%. Most recently, delinquencies have again increased as farm income hit lows in 2016 and financial conditions deteriorate, but nothing to the scale and pace observed during the Great Recession.

Figure 2. Share of Farm Real Estate Loans Delinquent, Q4. 1992-2018. Average: 2.3% (in black). Data Source: KC Federal Reserve Bank.
Wrapping it Up
When thinking about the impacts of COVID, a lot of attention has focused on farm-level challenges – commodity prices, revenue projections, etc. However, the farm sector could also face a second wave of challenges from off-farm related income. Again, keep the underlying demographics in mind.
The most recent unemployment rate data is at 14.7%, well above the October 2009 peak of 10.0%. It can be difficult to untangle the on-farm vs. off-farm impacts, but the previous downturn correlated with a decline in off-farm income and a large uptick in farm loan delinquencies. In fact, the uptick during the Great Recession was much more severe in terms of magnitude (more than doubling to 3.5%) and pace (in just three years) than anything observed in the last five years.
The farm economy was already in a precarious situation heading into 2020. Now comes the possible challenges of a double-hit to on-farm and off-farm income. It is early and stimulus efforts to help soften the blow will be important, but significant challenges could be ahead.
*This post was originally published for AEI Premium readers. The entire text can be accessed by users here, or via the risk-free 30-day trial here. Click here to learn more about AEI Premium.
Click here to subscribe to AEI’s Weekly Insights email and receive our free, in-depth articles in your inbox every Monday morning.
You can also click here to visit the archive of articles – hundreds of them – and to browse by topic. We hope you will continue the conversation with us on Twitter and Facebook.
Source: David Widmar, Agricultural Economic Insights
