Release of 2021 Illinois Crop Budgets
Planning for the 2021 crop will begin soon with the determination of 2021 cash rents, selection of 2021 seed hybrids and varieties, application of fertilizers and commencement of fall tillage. To aid with these decisions, Illinois Crop Budgets for 2021 have been released here. Projections for both 2020 and 2021 are in the Revenue and Costs for Illinois Grain Crops, along with actual results from 2013 to 2019 summarized from Illinois Farm Business Farm Management (FBFM), providing historical context. Given expected negative returns for 2021, careful management of expenses will be necessary to cut losses.
Northern Illinois Returns and Costs
Table 1 shows projected returns and costs for 2018 through 2021 for corn and soybeans in northern Illinois. A similar table for high-productivity farmland is available in a July 21, 2020 farmdoc daily article. Both regions have similar trends, although 2019 returns were worse in northern Illinois because of lower yields than in central Illinois.
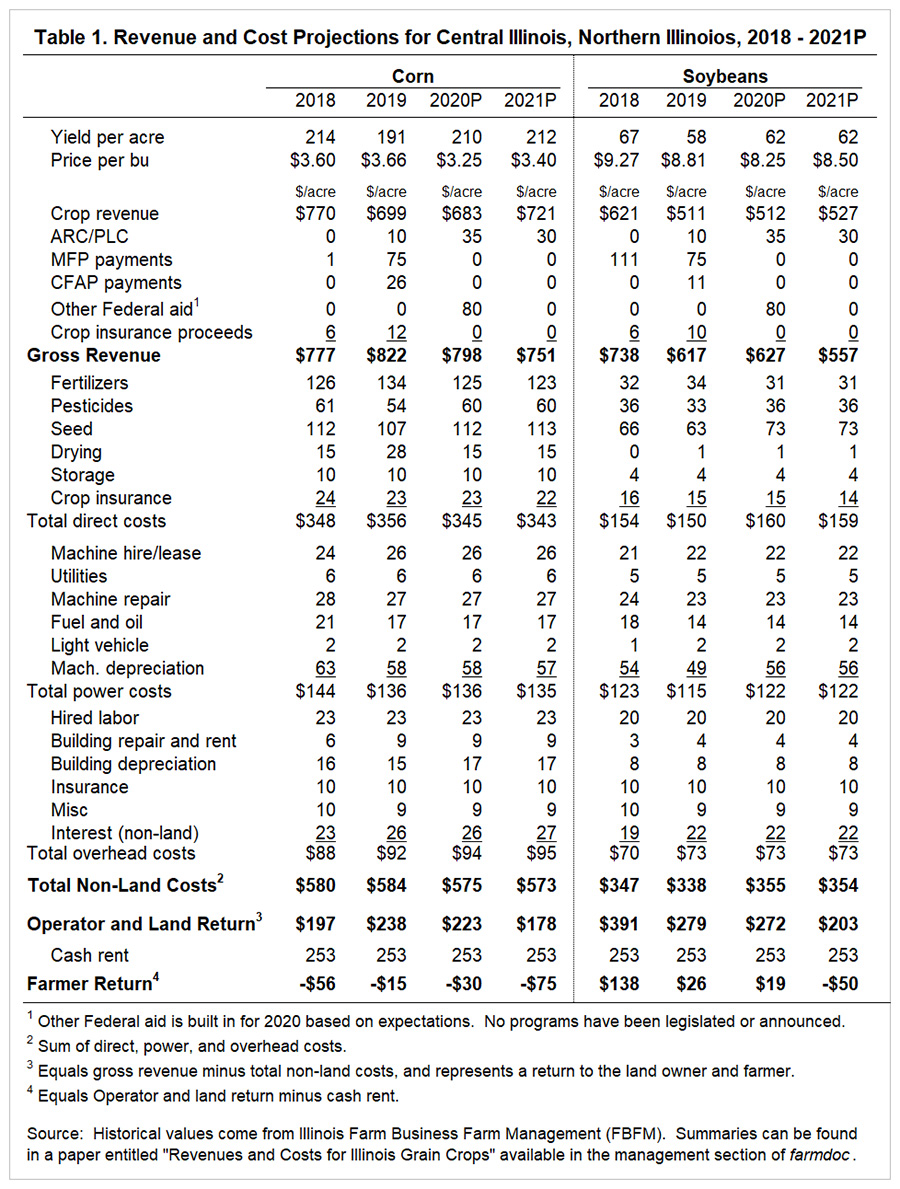
For 2021, farmer returns are projected at -$75 per acre for corn and -$50 per acre for soybeans. These are very low returns. Comparable returns data exists for corn and soybean production since 2000 (see Figure 1). If 2021 projections hold, corn and soybeans will both have negative returns. Except for 2017, soybeans had positive returns from 2014 to 2020, while corn had negative returns. In 2017, both corn and soybeans had negative returns (-$61 per acre for corn and -$3 per acre for soybeans). Combined across corn and soybeans, the 2021 farmer return is lower than any combined returns since 2000.

Projected 2021 Prices
Prices used in 2021 budgeting are $3.40 per bushel for corn and $8.50 per bushel for soybeans. These prices reflect current levels of futures prices for 2021 harvest-time delivery. On August 3, settlement prices on Chicago Mercantile Exchange (CME) contracts were $3.62 per bushel for the December 2021 corn contract and $8.96 per bushel for the November 2021 soybeans contract. Usual basis places cash prices near $3.40 per bushel for corn and $8.50 per bushel for soybeans.
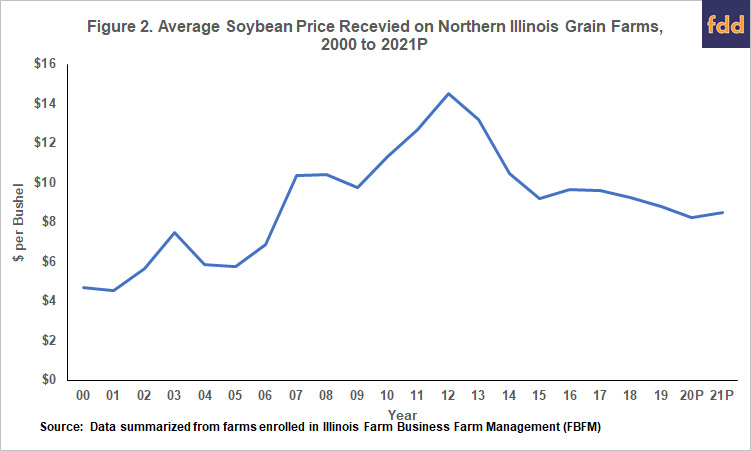
Those prices are low from a historical perspective, particularly for soybeans. After receding from 2006 to 2013 highs, soybean prices averaged $9.64 per bushel from 2014 to 2018 (see Figure 2). With trade difficulties, soybean prices fell to $8.81 per bushel in 2019. With the introduction of COVID-19 concerns in 2020, an $8.25 soybean price is projected for 2020. The 2021 price is $.25 per bushel higher than the 2020 price, reflecting a V-shaped economic recovery.
Government Payments
In 2018 and 2019, ad hoc Federal support in the form of Market Facilitation Program (MFP) and Coronavirus Food Assistance Program (CFAP) payments were important sources of revenue for the 2018 and 2019 crops. It seems reasonable to expect another round of assistance for 2020. As a result, projections for 2020 include $80 of ad hoc Federal aid, which has not been announced or legislated up to this point.
Figure 3 shows Federal aid on northern Illinois grain farms from 2000 to 2021. Note that these values are given a typical rotation in northern Illinois, and do not include additional disaster assistance payments on prevented plant acres in 2019. In 2000 and 2001, Federal payments were high due to Federal programs to counter low prices that occurred in the late 1990s and early 2000s. Between 2006 and 2018, Federal payments averaged $26 per acre. Total payments averaged $50 per acre in 2018 and $90 per acre in 2019. Of those 2018 and 2019 payments, over 90% came from MFP and CFAP programs which are not legislated to continue into 2020 and 2021. For 2020, Federal payments are projected at $117 per acre, with 70% of those being ad hoc which have not been announced or legislated. Commodity title programs in the form of Price Loss Coverage (PLC) and Agricultural Risk Coverage (ARC) make up the remainder of Federal aid in 2020. A total of $30 per acre in PLC payments is projected for 2021, with all of these payments being associated with PLC payments on corn base.
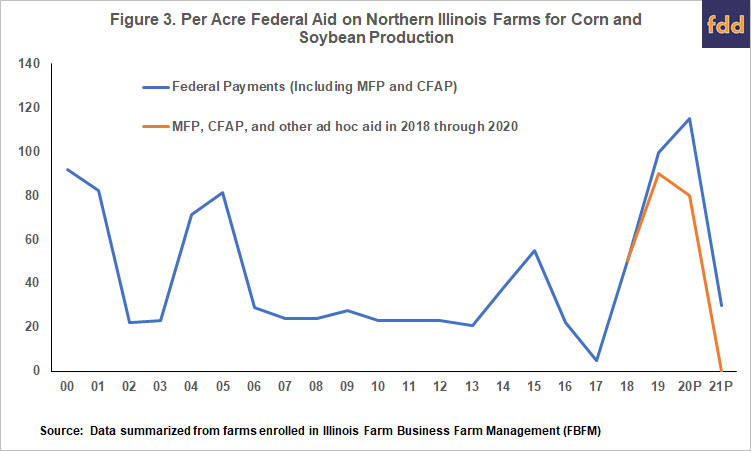
For 2021, no ad hoc payments are in 2021 budget projections. As a result, farmer returns are projected to be negative.
Non-land Costs
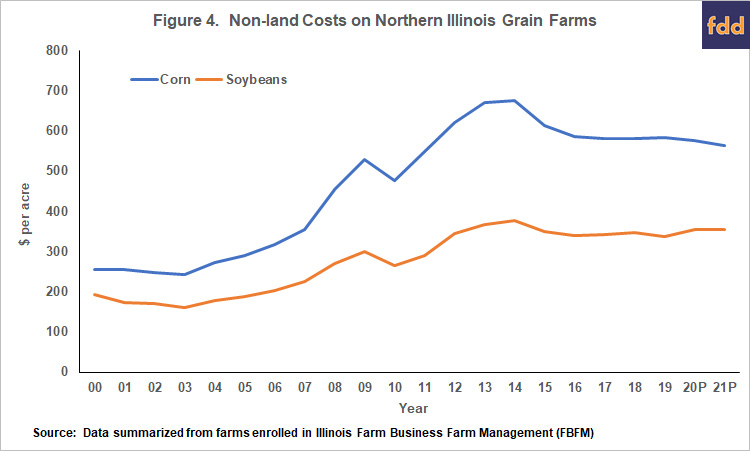
Non-land costs in 2021 are projected at $573 per acre for corn and $354 per acre for soybeans. Both of those costs are down slightly from 2020 levels. Overall, non-land costs increased dramatically from 2006 to 2013, with corn costs moving from $317 per acre in 2006 to $675 per acre to 2014, an increase of $358 per acre representing a doubling of non-land costs (see Figure 4). Since 2014, non-land costs have declined. Non-land costs on corn acres decreased from $675 per acre in 2014 to $584 per acre in 2019, a decrease of $86 per acre. The 2021 non-land costs are projected at $573, down by $9 from the 2019 level. Much of the decline from 2019 to 2020 is based on lower drying costs.
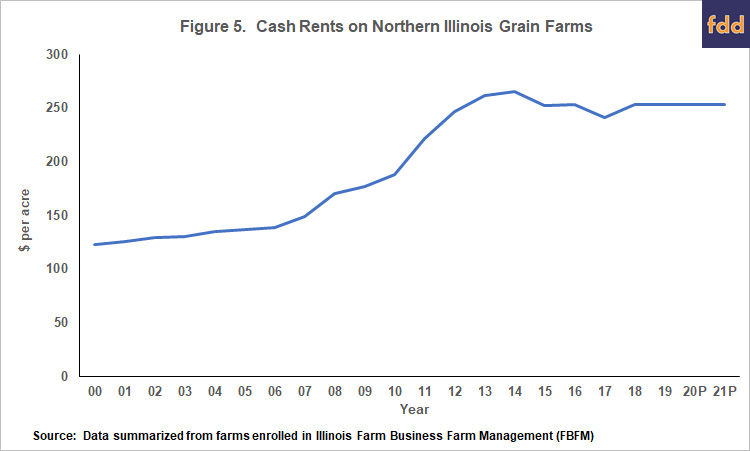
Cash Rents
Cash rents are projected at $253 per acre, which is the same rent as in 2019 and 2020. Similar to non-land costs, cash rents increased from $139 per acre in 2006 to $265 per acre in 2014, an increase of $126 per acre representing an almost doubling of cash rents. Average cash rents then fell by $12 per acre to $253 per acre in 2019. At this point, we are not projecting further declines in 2021 even though 2021 projected returns suggest cuts are needed. From 2013 to 2019, returns from cash rent farmland have been marginal at best. With additional ad hoc aid in 2020, another year of marginal returns likely will occur. Given that cash rents have not declined more given these marginal returns from 2013 to 2020, we suspect that projections of low 2020 returns will not result in large reductions in cash rents. Large losses likely to have to occur before widespread declines in cash rents occur.
Questions for 2021
Corn and soybean prices have been lower since 2013, with a further decline initiated in 2018 with trade concerns and then another decline in 2020 caused by COVID-19 and the impacts of associated control measures. Ad hoc Federal aid in the form of MFP and CFAP payments have helped counter reduced revenue losses from lower prices. That aid has delayed the need to cut both non-land costs and cash rents to align with the market for the crops.
For 2021, it does not seem reasonable to expect prices above those in our 2021 projections. While events in agriculture can always surprise, negative impacts on price are as likely as positive impacts. Given these farm income projections, attention turns to the outlook for federal aid in 2021 and the possibility for continuation of ad hoc aid programs or potentially a revision to the farm safety net (see farmdoc daily, July 29, 2020). Without such adjustments to provide farm support in 2021, cuts in non-land costs and cash rents will be needed to reduce losses, or approach a break-even returns level.
References
Schnitkey, G., K. Swanson, N. Paulson, C. Zulauf and J. Coppess. “2021 Budgeting Using $3.40 Corn and $8.50 Soybean Prices.” farmdoc daily (10):134, Department of Agricultural and Consumer Economics, University of Illinois at Urbana-Champaign, July 21, 2020.
Zulauf, C., G. Schnitkey, J. Coppess, N. Paulson and K. Swanson. “Ad Hoc Payments: A Leading Indicator of Farm Policy Change.” farmdoc daily (10):140, Department of Agricultural and Consumer Economics, University of Illinois at Urbana-Champaign, July 29, 2020.
Source: Gary Schnitkey, Krista Swanson, and Nick Paulson, Farmdocdaily