The Coronavirus and Ethanol Demand Destruction
Extraordinary restrictions have been put in place in an attempt to slow the spread of the coronavirus in the U.S. and many other nations. The restrictions range from shelter-in-place orders to milder social distancing guidelines. The result is a contraction in economic activity unlike anything witnessed since the Great Depression. For example, the U.S. Department of Labor reported that 3.3 million people filed for unemployment benefits last week alone, dwarfing any previous level even in recessions. One implication of the virus-related restrictions is that people are driving much less than before, which means that gasoline and ethanol use are declining. The impact on the price of ethanol has been swift and severe, as shown in Figure 1. The price of ethanol at the Iowa plant level has declined $0.32 per gallon, or 26 percent, since late February. There is naturally great interest in the magnitude of ethanol demand destruction and the implications for corn ethanol use going forward. The purpose of this article is to investigate the potential level of ethanol demand destruction over the next few months and the associated impact on corn ethanol use.

Analysis
We begin by reviewing the available data of the impact of coronavirus restrictions on gasoline use in the U.S. The weekly use of gasoline in the U.S. can be derived from stock and production data published in the EIA Weekly Petroleum Status Report. The latest available data on implied gasoline use is shown in Figure 2. It reveals a steep drop in implied gasoline use for the week ending March 20th, about 9 percent and well below the level of 2019 and the five-year average. This is obviously only a partial picture because many of virus-related restrictions had just been instituted last week and more have been instituted since. Qualitative indicators of the full impact on miles driven and gasoline use are provided by traffic statistics in metro areas and pollution levels. A recent New York Times article provides anecdotal evidence of traffic declines in major U.S. cities of 40 to 60 percent and correspondingly large reductions in air pollution.

While this information is helpful, it does not provide a sufficient foundation for making national projections of the impact on gasoline and ethanol use. The approach we take here is based on the level of restrictions currently in place in every state in the U.S., making an assumption about the impact of the restrictions on miles driven and gasoline use, and then weighting the impact by the proportion of gasoline use represented by each state. The specific steps are as follows:
- We use the Covid Act Now website to place each state in the U.S. plus the District of Columbia into three categories of virus-related restrictions: shelter-in-place, social distancing, and limited action. The website contains definitions used to place a state in each category. As of March 25, 2020, 19 states were in the shelter-in-place category, 23 states were in the social distancing category, and 9 states were in the limited action category.
- We use data from the EIA on gasoline consumption by state in 2018 to estimate the percentage of U.S. gasoline consumption in the three restriction categories. Using this data, we estimate that 44.9 percent of U.S. gasoline consumption is represented by states in the shelter-in-place category, 43.7 percent in the social distancing category, and 11.4 percent in the limited action category.
- The most difficult step is to estimate the reduction in gasoline use for each of the three categories of states. As a rough approximation, we assume a 50 percent reduction for the shelter-in-place category, 25 percent for the social distancing category, and no reduction for the limited action category. The 50 percent reduction for shelter-in-place seems consistent with the qualitative data discussed above and we arbitrarily assume that social distancing reduces miles driven and gasoline use by half as much. These assumptions result in a weighted-average national reduction in gasoline use of 33 percent.
- We prorate the impacts for the month of March by assuming no change for the first 20 days and the weighted-average 33 percent reduction for the last 11 days of March. We assume the full 33 percent reduction for the month of April, and only half as much reduction (16.5 percent) for the month of May to reflect an expectation of the lifting of some restrictions.
We apply these assumptions to gasoline and ethanol use for March through May 2020 in Table 1. As a base for comparison, the first line of the table shows the EIA March STEO projections for gasoline use in these three months. We assume that these are “pre-restriction” estimates. The second line shows the estimated gasoline use based on the procedure outlined in #1 – #4 above and the third line is the difference between the two sets of projections for gasoline use. The monthly reductions in gasoline use are 1.4 billion gallons in March, 3.9 billion gallons in April, and 2.1 billion gallons in May. The total reduction for these three months is 7.3 billion gallons, which represents 5.1 percent of total 2020 gasoline use projected by the EIA in the March STEO. Even when the reductions are assumed to be limited to March through May, the impact on annual gasoline consumption is substantial.

We convert the monthly reductions in gasoline use in Table 1 to reductions in ethanol use by assuming a constant blend rate of 10.1 percent for ethanol, which is the long-run average blend rate in recent years (e.g., farmdoc daily, February 8, 2019). The monthly reductions in ethanol use are 143 million gallons in March, 391 million gallons in April, and 207 million gallons in May, for a total reduction of 741 million gallons. As a final step, we convert the reductions in ethanol use to reductions in corn ethanol use by dividing the ethanol reductions by 2.9, near the conversion rate for the ethanol industry in recent months (farmdoc daily, January 29, 2020). The projected reductions in corn ethanol use for the three months total 256 million bushels, an amount that would materially increase corn ending stocks for the 2019/20 marketing year.
While we did not include it in Table 1, one can also compute reductions in dried distillers grains with solubles (DDGS) production associated with drops in ethanol production of the size found in Table 1. Assuming that production of each gallon of ethanol is associated with 5.7 pounds of DDGS production (16.5 pounds of DDGS per bushel of corn), a reduction of 2.1 million tons of DDGS would be expected. This represents about 75 million bushels of corn, and this could offset some of the lost corn demand associated with lower ethanol production and use.
The reductions in gasoline, ethanol, and corn use discussed above are based on the assumption that virus-related restrictions in place in late March stay in place through the entire month of April and then lessen in May. There is obviously considerable uncertainty whether this will turn out to be the case. To provides some perspective on a possible worst-case scenario, we re-do the analysis assuming that 80 percent of gasoline demand is represented by the shelter-in-place category and 20 percent is represented by the social distancing category. All other assumptions remain the same. In this alternative scenario, the total decline in gasoline use for the three months is 9.9 billion gallons, the decline for ethanol use is 999 million gallons, and the decline in corn use for ethanol is 345 million bushels. We could also consider scenarios that lengthen and shorten the amount of time that the restrictions are in place, which would correspondingly increase and decrease the projections of demand destruction.
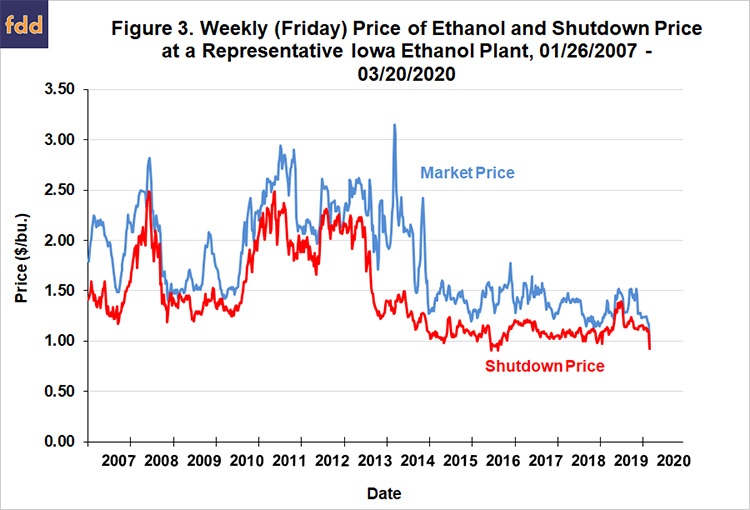
As a final step in the analysis, we examine the signal that the market is providing to ethanol producers to shut down production. Figure 3 shows the weekly market price of ethanol at plants (same as in Figure 1) and the shutdown price for a representative ethanol plant over January 26, 2007 through March 20, 2020. The representative plant model is discussed in detail in the farmdoc daily article of January 29, 2020. The shutdown price equals variable costs minus non-ethanol revenue (DDGS and corn oil). It turns out that the market price and the shutdown price are basically the same right now, about $0.92 per gallon. The implication is that the market is signaling that the representative plant should be shutting down or at least reducing production drastically. It is no surprise then to read reports of ethanol companies shuttering half of their production, although this is a larger reduction than the analysis in Table 1 suggests is necessary.
Implications
The coronavirus pandemic is having profound impacts on the U.S. economy. A key question for the grain markets is how much ethanol demand destruction will be caused by the ongoing economic contraction. We develop a procedure here to estimate ethanol demand destruction based on the impact of virus-related restrictions on gasoline use in the U.S. for the March through May 2020 period. The estimated reductions in ethanol use are 143 million gallons in March, 391 million gallons in April, and 207 million gallons in May, for a total reduction of 741 million gallons. Converting these to reductions to corn used to produce ethanol results in a total reduction in corn ethanol use for the three months of 256 million bushels, an amount that would materially increase corn ending stocks for the 2019/20 marketing year. These projections should be viewed with considerable caution, as there is still great uncertainty about the path of the coronavirus pandemic and the severity and length of restrictions necessary to contain the spread. Upcoming weekly EIA reports on the pace of gasoline consumption will provide crucial data whether the pace of demand destruction is better or worse than our projections.
References
Irwin, S. “2019 Ethanol Production Profits: Just How Bad Was It?” farmdoc daily (10):16, Department of Agricultural and Consumer Economics, University of Illinois at Urbana-Champaign, January 29, 2020.
Irwin, S. “Why are Ethanol Prices So Low?” farmdoc daily (9):23, Department of Agricultural and Consumer Economics, University of Illinois at Urbana-Champaign, February 8, 2019.
Source: Scott Irwin and Todd Hubbs, Farmdocdaily