Trade Progress with China-Disappointing
In January, the U.S. and China ceremoniously signed the Phase 1 trade agreement. This was a positive development for U.S. agriculture, especially on the grains side. While there was ambiguity about the metrics and some doubt about China’s ability to meet those goals, the consensus was that China would be buying a lot of U.S. ag products. This week’s post is a look at China’s purchases of U.S. ag products in 2020.
Soybeans
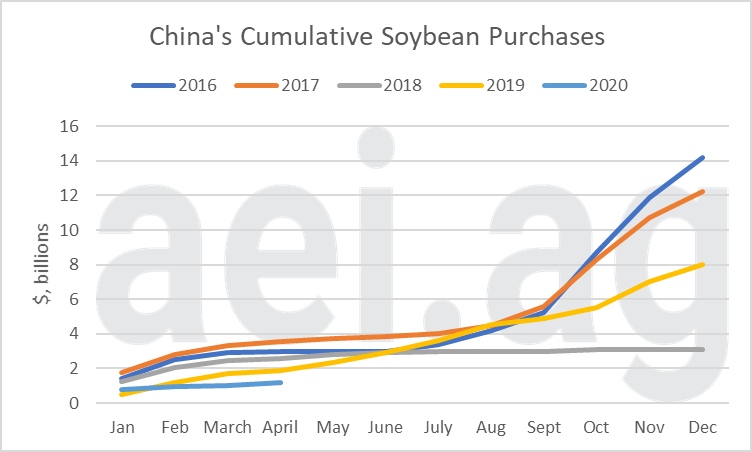
Before the trade war, soybean exports accounted for 51% of all U.S. ag exports to China. Figure 1 shows China’s cumulative monthly purchases. After $778 million in sales in January, soybeans have mostly stalled as total 2020 sales reached $1.2 billion through April.
Cumulative monthly sales are useful to consider conditions as it gives us an idea of monthly activity, along with overall progress. In January, soybean sales outpaced 2019 activity but have since slumped. To date, 2020 soybean sales to China, measured in dollars, are the lowest in five years.
A second point to consider is how far behind current levels are compared to pre-trade war levels. In 2016 and 2017, cumulate soybean exports had reached $2.9 and $3.7 billion, respectively.
Finally, notice how seasonal China’s soybean purchases are. There is a jump at the beginning of the year, followed by almost no additional activity in the summer month. A flurry of activity then takes place during the last quarter. Before the trade war (2008 – 2017), China purchased 57% of total annual soybeans between October and December.

Figure 1. China’s Cumulative Monthly Purchases of U.S. Soybeans, 2016-2020. Data Source: USDA’s FAS and aei.ag calculations.
Total Ag Purchases
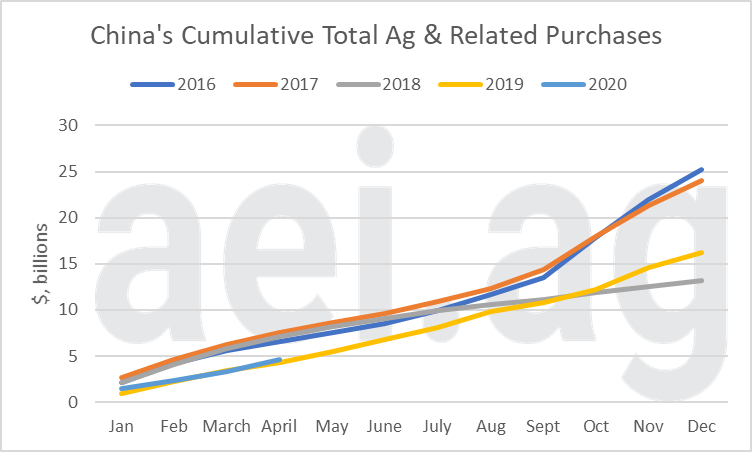
Figure 2 shows progress toward China’s total ag purchases (Ag & Related Products). Through April, annual purchases approached $4.6 billion, mostly on par with 2019’s par ($4.3 billion through April 2019). As a comparison, sales through April 2017 were $7.1 billion.

Figure 2. China’s Cumulative Monthly Purchases of U.S. Ag & Related Products, 2016-2020. Data Source: USDA’s FAS and aei.ag calculations.
Wrapping it Up
In recent weeks, there has been much attention to China’s purchases. Broadly speaking, the latest chatter has focused on 1) the purchase activity of specific commodities (meats or sorghum, for example), or 2) focused on China’s purchase commitments for later in the year. That news has been mostly positive but often overlooks the big picture. Based on the first four months of 2020, trade with China has been disappointing.
An additional headwind for reaching the Phase 1 goals will be lower commodity prices. While grain markets will focus on the bushels exported, progress towards a Phase 1 trade agreement is – at least for now – based on dollars. Lower commodity prices mean, all else equal, higher quantities necessary to reach the threshold.
If you’re considering the possibility of China purchasing record levels of U.S. ag products in 2020, one has to concede the hurdle is greater after four months of activity in the books.
Perhaps most disappointing is that China’s purchases have not broken out of the Trade War rut. Even if you were skeptical about China hitting the Phase 1 goals, the prospects of China returning to pre-trade war levels seemed very likely in early 2020. However, thus far, not even an improvement has been measured.
Within the Ag Forecast Network, users have been sharing their expectations about China’s purchases of U.S. Ag and Related Products exceeding $35 billion in 2020. Early in 2020, the Consensus peaked at a 50% chance of occurring. Since early February, a host of factors – included COVID- resulting in expectations collapsing, with the Consensus currently at 10%. Update your forecast, or join the AFN challenge here.
Click here to subscribe to AEI’s Weekly Insights email and receive our free, in-depth articles in your inbox every Monday morning.
Looking for more? AEI Premium provides even more insights and content. It is also where you can challenge your thinking with the Ag Forecast Network (AFN) tool. Start your risk-free trial here.
Source: David Widmar, Agricultural Economic Insights
