U.S. Corn, Soybeans, and Wheat in World Perspective
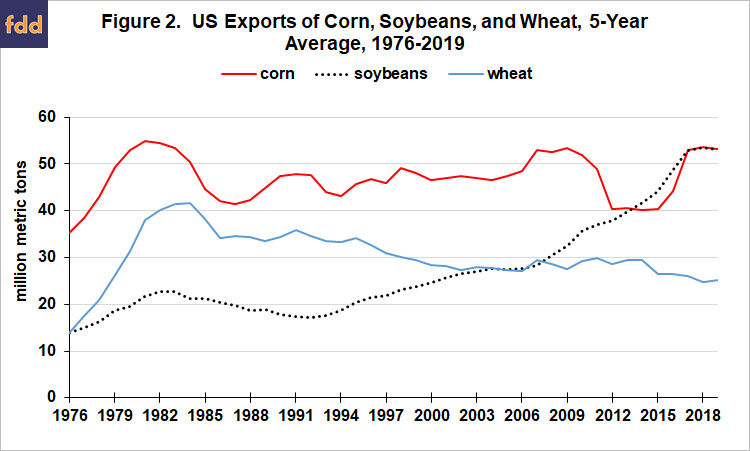
Wide-spread concern exists over the large decline in US share of world corn, soybean, and wheat exports (see Figure 1). Moreover, quantity of corn and wheat exports have never consistently exceeded their early 1980 levels (see Figure 2). Tariff wars have heightened the concern. Long term impact of the tariff wars is a concern, but this article argues that graphs such as Figures 1 and 2 exaggerate the decline in US agriculture’s international standing and mask key relationships that frame private and public decisions. Data cited in this article come from PSD (Production, Supply, and Demand website).
Reasons for Exaggeration
- Growth in domestic US use is ignored. US consumption of meat, livestock products, and especially biofuels has grown, displacing exports, everything else remaining the same. Zulauf estimates US corn exports are 1.4 billion bushels smaller than if US corn market trends of 1984-2004 had continued to hold (farmdoc daily, 11/20/2019).
- US policy changes are ignored. In particular, CRP (Conservation Reserve Program, which was authorized in 1985, pays for taking environmentally sensitive cropland out of production. Fewer cropped acres mean prices are higher than they would otherwise. Higher prices reduce demand for exports more than domestic demand, resulting in fewer exports or slower growth in exports.
- Broader markets in which a crop exists are ignored. Corn is a feed grain, soybean is an oilseed, and wheat is a food grain. Corn and soybeans are preferred among these crops around the world. However, their share of harvested feed grain-food grain-oilseed acres has increased more in the US (from 50% in 1972-1976 to 71% in 2015-2019 vs. 15% to 29% for rest of the world). Faster growth in preferred crops imparts an advantage to the US.
Conclusion
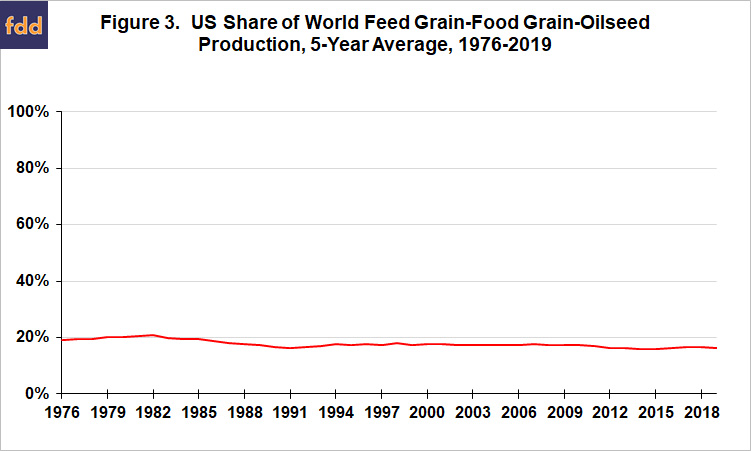
A more encompassing and likely more accurate measure of US agriculture’s international role is its share of aggregate world feed grain-food grain-oilseed production.
US share of world feed grain-food grain-oilseed production has declined, but by much less: from 19.3% in 1972-1976 to 16.2% in 2015-2019 (see Figure 3 and Data Note). This conclusion also holds for relative share decline. Relative decline in US share of world corn exports is -52%. It is calculated as percent change in 2015-2019 share from the 1972-1976 share, specifically [1 – (34.9% / 72.8%)] (percent values from Figure 1). Relative decline in US export share is -62% for soybeans and -69% for wheat. In contrast, relative decline in US share of world feed grain-food grain-oilseed production is only -16% (1 – (16.2% / 19.3%).
Closer Look
Because magnitude of a share matters, it is important to examine a share over its range of values (0% to 100%), as Figure 3 does. But, such a graph can mask important smaller, shorter-run changes. Figure 4, a smaller magnitude picture, clearly reveals 2 periods of decline. The first peak-to-trough is from 1982 (20.9%) to 1991 (16.3%). It closely follows the 1973-1980 crop prosperity period. The second peak-to-trough is from 2007 (17.6%) to 2015 (15.9%). It largely overlaps the 2007-2013 crop prosperity period. However, declines in 2018 and 2019 beg a question, “Have the tariff wars undone a possible stabilization in US share following large price declines since 2012?” Between the two declines, US share partially recovered, likely due in part to the large reduction in US prices due to policy changes enacted in the 1985 farm bill.
Role of US Acres
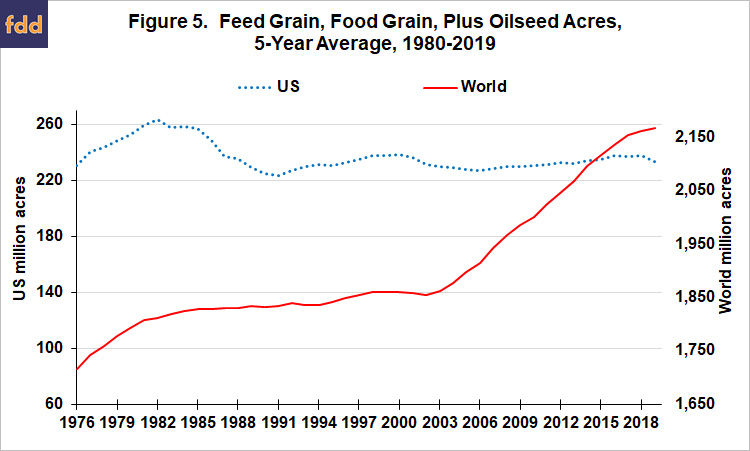
Since the early 1980s, all growth in cumulative US production of feed grains, food grains, and oilseeds has come from yield as harvested acres declined by 26 million (see Figure 5). Since 2000, harvested acres have essentially not changed in the US while increasing by 301 million in the rest of the world. The constraint on US acres reflects both bioclimatic factors and public policy. It seems unlikely to change in the near future. The constraint means, if US domestic consumption grows faster than US yield, prices will increase, giving rest of the world an incentive to bring acres into production. This scenario played out as the US expanded its biofuel markets since 2000.
Summary Thoughts
A widely-expressed concern is the decline in US share of world corn, soybean, and wheat exports.
This decline however exaggerates the decline in US agriculture’s international standing. It also masks key relationships that frame private and public decisions.
A more accurate perspective is US share of world feed grain-food grain-oilseed production. This share has declined but by much less than US share of world corn, soybean, or wheat exports.
The decline occurred in two periods: 1982-1991 and 2007-2013. The second decline has, so far, been much less than the first. But, declines in 2018 and 2019 prompt the question, “Is the second decline resuming, especially in light of the tariff wars?”
A key feature of contemporary US agriculture is a constraint on cropped acres. Given this constraint, growing US demand faster than yield means most of the benefits accrue to the rest of the world as they bring more acres into production. Such has occurred since 2000 as the US expanded its biofuels markets.
The US cropland constraint prompts the following policy questions / issues. Given this constraint,
- What is the appropriate role and funding for export promotion programs?
- What should US biofuels policy be, in particular the size of mandated markets?
- What should be the size and goal of US conservation land retirement programs?
- What is the appropriate role and funding for public agricultural research?
These issues span multiple titles in the farm bill, suggesting the US cropped acres constraint could be a foundation theme directing debate over the next farm bill.
Data Note
PSD reports production in metric tons for feed grains (barley, corn, millet, oats, sorghum); food grains (rice, rye, wheat); and oilseeds (copra, cottonseed, palm oil, palm kernel meal, palm kernel oil, peanuts, rapeseed, soybeans, sunflowers). Harvested acres in hectares are reported for these crops, but only for oil palm, not palm kernel meal and palm kernel oil.
References and Data Sources
US Department of Agriculture, Foreign Agriculture Service. March 2020. PS&D: Production, Supply, and Demand. https://apps.fas.usda.gov/psdonline/app/index.html#/app/home
Zulauf, C. “Has Ethanol Increased Total US Corn Use?.” farmdoc daily (9):219, Department of Agricultural and Consumer Economics, University of Illinois at Urbana-Champaign, November 20, 2019.
Source: Carl Zulauf and Krista Swanson, Farmdocdaily


