USDA Reports Review
Slightly Bullish Soybean and Bearish World Wheat Stocks

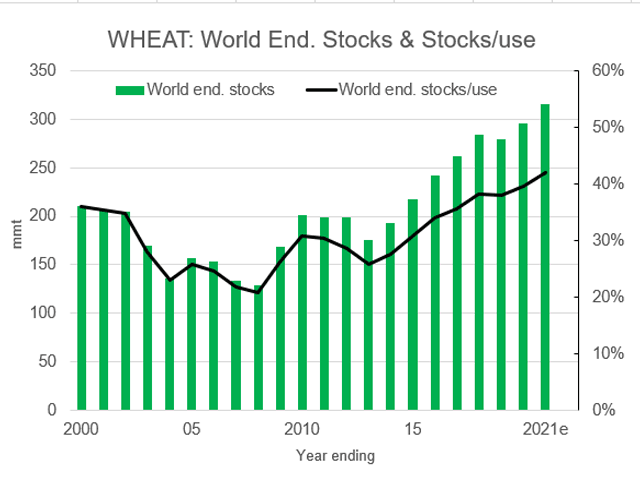
This chart shows the trajectory of world wheat ending stocks, featuring yet another new record large ending stocks number of 316 million metric tons (11.6 billion bushels). (DTN chart)
The June Crop Production and World Agricultural Supply and Demand Estimates (WASDE) reports are typically not big market-movers and 2020 was no exception. Only minor changes were reported for corn and wheat, while the most substantive changes came in the 2020-21 U.S. and world soybean numbers and 2020-21 world wheat production and ending stocks.
Market reaction to the June 2020 WASDE report was minimal, with corn up before and after the report by a similar amount; soybeans little changed and Kansas City wheat just a bit weaker post-report. July corn finished 3 1/2 cents higher, July soybeans 1/2 cent higher and Kansas City July wheat closed down 10 1/2 cents, weakening 4 cents after the report came out.
CORN
The June WASDE report featured only minimal changes to both the U.S. and world corn balance sheets. Beginning stocks were raised by 5 million bushels (mb), with a 45 mb reduction in 2019-20 production being more than offset by the 50 mb decline in corn used for ethanol. The reduction in production was primarily due to North Dakota, where a resurvey revealed a decline of 38.2 mb from the previous year due to the state’s yield falling to just 131 bushels per acre (bpa), down 22 bpa from a year ago.
U.S. corn production fell from 13.663 billion bushels (bb) to 13.617 bb. Ending stocks for 2020-21 rose by 5 mb to 3.323 bb, which was about 17 mb lower than Dow Jones’ pre-report estimate.
The 2020-21 ending stocks number is burdensome by any measure. With good growing conditions, it could even move higher if corn ethanol usage is lowered in future reports.
The 2019-20 world ending stocks number came in lower than expected at 312.91 million metric tons (mmt), or 12.31 bb. The pre-report estimate predicted a slight increase to 315.1 mmt.
While corn production for Argentina and Brazil was left unchanged at 50 mmt and 101 mmt, respectively, 2020-21 corn exports were raised for Argentina and lowered for Brazil.
For 2020-21, corn ending stocks were lowered 2 mmt to 337.87 mmt (13.3 bb), which was close to the estimate and down from May’s 339.6 mmt. Just minor reductions were pegged for China, Argentina, South Africa and Paraguay, and slight increases for Brazil and India.
SOYBEANS
Thursday’s reports revealed higher beginning stocks for soybeans, as production was lowered following the resurvey of North Dakota, with U.S. production falling by 5 mb to 3.552 bb.
Soybean crush was increased by 15 mb while soybean exports were lowered by 25 mb due to competition from Brazil. With the higher (585 mb) carry to start 2020-21 and increased domestic use of soybean meal, 2020-21 ending stocks fell to 395 mb, down 10 mb from May, but 64 mb lower than predicted before the report. The average prices for both soybeans and products were left unchanged.
World soybean ending stocks for 2019-20 came out about 1.1 mmt lower than May and the pre-report estimate at 99.19 mmt (3.64 bb). Ending stocks for 2020-21, also projected to be about 100 mmt (3.67 bb), was revealed at a lower than expected 96.34 mmt (3.54 bb).
Production for Argentina and Brazil were left unchanged at 50 mmt (1.84 bb) and 124 mmt (4.56 bb), respectively.
For 2019-20, exports were raised by 1 mmt each for Argentina and Brazil based on the pace of shipments, increased crush demand and imports by China. U.S. exports were reduced slightly to offset part of that. The lower stocks were mostly attributed to Argentina (down 1.4 mmt) and Brazil (down nearly 1 mmt).
WHEAT
The reports featured only minor changes in the U.S. wheat balance sheet. For 2019-20, a 5 mb decline in 2019-20 exports and an 11 mb gain in winter wheat production resulted in 2019-20 ending stocks of 585 mb, 5 mb higher than in May, and a 2020-21 ending stocks number of 925 mb, up 16 mb from May and 21 mb higher than the average estimate. Hard red winter production rose 1% to 1.266 bb, as did white wheat to 225 mb. Soft red production was just slightly lower than in May at 297 mb.
On the world front, wheat supplies were up nearly 6 mmt (220 mb), with production raised by 4.9 mmt and stocks increased by 6 mmt to a new record large of 316.09 mmt (11.6 bb). Notable changes were an increase of 2 mmt in Australia production and a 4.2 mmt gain in India production to a new record large of 107.18 mmt (3.94 bb). There were also reductions in EU production by 2 mmt to 141 mmt (5.2 bb) and Ukraine production by 1.5 mmt to 26.5 mmt. Turkey and China both had a 1 mmt increase in production.
Source: Dana Mantini, DTN
