USDA Weekly Crop Progress Report
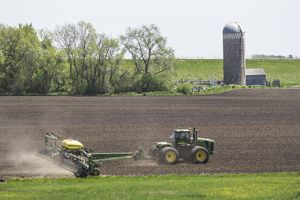
 U.S. corn planting slowed somewhat last week but still ended the week well ahead of last year and the five-year average, USDA NASS said in its weekly Crop Progress report on Monday.
NASS estimated that 67% of the nation’s intended corn crop was planted as of Sunday, May 10, a gain of 16 percentage points from the previous week. That wasn’t quite as impressive as the 24-percentage-point jump in planting progress the previous week, but it was still enough to put this year’s current pace at 39 percentage points ahead of last year at the same time and 11 percentage points ahead of the five-year average of 56%.
“Ninety-one percent of Iowa’s corn and 89% of Minnesota’s corn is planted, well ahead of their typical paces, while Illinois is 68% and Nebraska is 79% done,” said DTN Senior Analyst Dana Mantini.
Corn emergence also saw a significant jump last week, with 24% of the crop emerged as of Sunday, up from 8% last week. That was well ahead of 9% last year and slightly ahead of the average pace of 22%.
Meanwhile, soybean planting maintained a steady pace last week, moving ahead another 15 percentage points to reach 38% complete as of Sunday. That is well ahead of 8% last year and 15 percentage points ahead of the five-year average of 23%.
“Iowa soybeans are 71% planted, Minnesota is 57%, Nebraska is 54% and Illinois is 43% done,” Mantini said.
In its first soybean emergence report of the season, NASS estimated that 7% of the crop was emerged as of Sunday, ahead of both last year’s 1% and the five-year average of 4%.
Spring wheat planting continued its steady but slow progress as well last week. NASS estimated that 42% of the crop was planted as of Sunday, slightly ahead of 38% last year but still 21 percentage points behind the five-year average of 63%.
“Key spring wheat state North Dakota is 27% planted, up from 12%, and Minnesota is 40% planted, up from 19% last week,” Mantini said.
Sixteen percent of the spring wheat crop had emerged, ahead of 8% last year but behind the five-year average of 29%.
After holding steady the previous week, winter wheat conditions saw another drop last week. NASS estimated that 53% of the nation’s winter wheat was rated in good-to-excellent condition as of Sunday, down 2 percentage points from 55% the previous week. The current good-to-excellent rating is below 64% a year ago.
“Kansas winter wheat was at 38% good to excellent, down from 42% last week, and 24% of the Kansas crop is in poor-to-very-poor condition,” Mantini said. “Nebraska winter wheat is 68% good to excellent, Oklahoma is 56% and Texas is 51% good to excellent.”
Winter wheat was 44% headed as of Sunday, ahead of 38% last year but behind the five-year average of 50%.
Sorghum was 28% planted, ahead of 23% last year but behind the five-year average of 30%. Oats were 78% planted, compared to 59% last year and a 78% average. Oats emergence was at 55%, compared to 41% last year and a 59% average. Barley was 60% planted, ahead of 53% last year, but behind the five-year average of 68%.
Cotton planting was 32% complete, compared to 24% last year and a 27% average. Rice was 70% planted, ahead of 53% last year but behind the average of 75%. Rice emerged was 43%, behind the average of 57%.
To view weekly crop progress reports issued by National Ag Statistics Service offices in individual states, visit http://www.nass.usda.gov. Look for the U.S. map in the “Find Data and Reports by” section and choose the state you wish to view in the drop-down menu. Then look for that state’s “Crop Progress & Condition” report.
| National Crop Progress Summary | ||||
| This | Last | Last | 5-Year | |
| Week | Week | Year | Avg. | |
| Corn Planted | 67 | 51 | 28 | 56 |
| Corn Emerged | 24 | 8 | 9 | 22 |
| Soybeans Planted | 38 | 23 | 8 | 23 |
| Soybeans Emerged | 7 | NA | 1 | 4 |
| Winter Wheat Headed | 44 | 32 | 38 | 50 |
| Spring Wheat Planted | 42 | 29 | 38 | 63 |
| Spring Wheat Emerged | 16 | 6 | 8 | 29 |
| Cotton Planted | 32 | 18 | 24 | 27 |
| Sorghum Planted | 28 | 22 | 23 | 30 |
| Barley Planted | 60 | 41 | 53 | 68 |
| Barley Emerged | 24 | 12 | 21 | 37 |
| Oats Planted | 78 | 67 | 59 | 78 |
| Oats Emerged | 55 | 44 | 41 | 59 |
| Rice Planted | 70 | 49 | 53 | 75 |
| Rice Emerged | 43 | 32 | 40 | 57 |
**
| National Crop Condition Summary | |||||||||||||||||
| (VP=Very Poor; P=Poor; F=Fair; G=Good; E=Excellent) | |||||||||||||||||
| This Week | Last Week | Last Year | |||||||||||||||
| VP | P | F | G | E | VP | P | F | G | E | VP | P | F | G | E | |||
| Winter Wheat | 5 | 11 | 31 | 45 | 8 | 4 | 10 | 31 | 48 | 7 | 2 | 6 | 28 | 49 | 15 | ||
Anthony Greder can be reached at anthony.greder@dtn.com
Follow him on Twitter @AGrederDTN
Source: Anthony Greder, DTN
