What Was USDA Thinking?
 USDA told us in the June 28 Grain Stocks and Acreage reports on Friday that producers had planted, or still intended to plant, 91.7 million acres (ma) to corn in 2019. That number is 2.57 ma more than last year. Traders had assumed, based on pre-report surveys, that USDA would show a reduction of 2.1 ma from 2018 and a 5.76-ma drop from the March Prospective Plantings report.
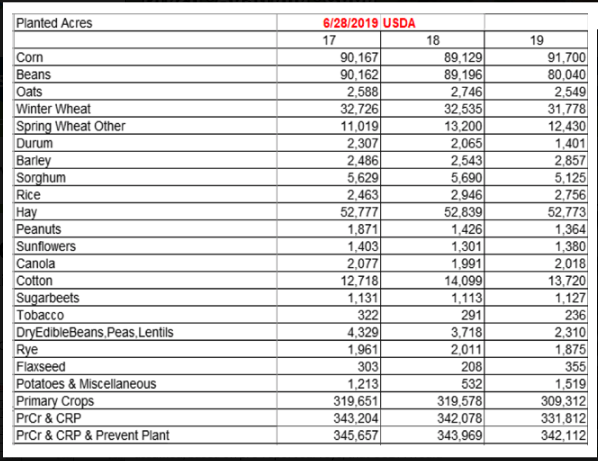
This table compares estimated planted acres from the USDA June 28 Acreage report to planted acres from 2017 and 2018. (Table by Alan Brugler)
WASDE had a 3-ma drop in its June estimate (to 89.8 ma), so Friday’s figure was actually reversing part of the preliminary move made by the armchair folks. Everybody knows that there are big swaths of unplanted ground across the Midwest, and it is too late to plant corn for grain and safely assume maturity before frost.
So, what were those NASS analysts thinking, and what are they likely to do next?
Disclaimer: I don’t buy into the conspiracy theories that USDA makes the numbers whatever “those in power or influence” want them to be. There is no plan to lower corn prices so the Chinese can buy more after a deal, etc. If that kind of thing is going on, we want an FBI investigation. I see USDA staffers trying to do their job to the best of their abilities and believe their data is overall better than any limited sample you will get from a private group or firm. Their surveys have a standard error of +/- so much, and the numbers they show need to be within that standard error. So, let’s try to figure out the logic, in order to figure out what might come next.
First of all, NASS confirms that this is an incomplete body of work. They indicated after the report release that 16.7% of the corn acreage and more than 40% of the soybean acreage had not been planted as of the date producers were reporting to NASS. Those surveys began around June 1, but data was accepted through June 17. Thus, there is some potential shifting of intentions or interference by reality within the survey responses. Some of that ground likely never got planted.
USDA will resurvey 14 states in July to try to find out what happened to the ground that had not been planted at the time of the survey response, and any changes, “if needed,” will be shown in the August Crop Production report. NASS will also have access to partial prevented planting data by the August report.
Speaking of prevented planting (PP) acres, NASS personnel were instructed not to include farmer-confirmed PP acres in the planted acres total. If you told USDA you were going PP on some ground, that should not be included in the 91.7 ma corn or 80.04 ma soybean figure. That said, we have heard county-level personnel were inconsistent in how this was implemented.
PP acres are a hot topic, as everyone can see the standing water and the fields with weeds and no crop. That was a big argument pre-report for corn acres being reduced and not increased. However, the report actually does imply 10.3 ma of PP claims that are not showing in the crop tables. Each of the past four years, the principal crop acreage has been a little over 319 ma, and last year it was 319.6 ma. The total this year is 309.312 ma, an implied PP of 10.3 ma more than that from last year.
I would also like to point out that there were 4.4 million implied PP acres in the March Prospective Plantings report, and those surveys took place during and after the Midwest “bomb cyclone” and the first round of flooding. The shift from March to June is 5.9 ma away from some crops in the table. The bulk of that is coming from soybeans in USDA’s current telling.
While we know that it was getting late for planting corn by mid-June, there are a couple reasons why we might have seen corn intentions go up. I had been hearing that, in areas where planting could be done, more corn was going in than intended in March. That should happen, with the new-crop soy-to-corn ratio in early June down to 2.1:1. Anything under 2.4 historically draws corn acres away from soybeans, and below 2.3 tends to bring a lot larger shift.
Producers had incentives to switch from soybeans to corn if they could possibly get the corn in the ground. The other consideration is silage, which takes up about 7 ma to 7.5 ma per year. While you want ears on it, it doesn’t have to reach full maturity and thus can be planted late. A big chunk of that yet-to-be-planted corn acreage may have been intended for silage.
While the announcement came out too late for it to affect this survey, USDA has now announced that producers can file a prevented planting claim, plant corn as the required cover crop and harvest the silage after Sept. 1 under emergency haying and grazing provisions. In areas with significant cattle numbers, that will tend to keep the corn planters rolling long after crop insurance won’t cover the loss. Those acres would be included in the 91.7 ma planted, but not in the “Harvested for Grain” category. It is the latter, multiplied by average yield, that gives us U.S. production.
One last consideration is that there is a disconnect between what you plant and what crop insurance will pay for. Both corn and soybeans are typically insured, but the spring prices make a PP claim for corn more attractive than a PP claim for soybeans. You’ll take the latter if you have to, but would prefer to show any unplanted acreage as corn acres. Many farms have enough flexibility within their base acres to show some lost acreage as corn ground even if they might have intended to plant soybeans on it back in March. Some of the “missing” soybean acres will likely show up in August as prevented planting for corn.
Let’s just say that this is not the last word on 2019 corn acreage, and we haven’t even started the yield discussion yet.
Read more about the USDA report here.
Alan Brugler can be reached at alanb@bruglermktg.com
Source: Alan Brugler, DTN